
Decoding the Conversion Matrix: What Unbounce’s 2024 Benchmark Report Reveals About Landing Page Performance

Executive Overview
In the high-stakes arena of digital marketing, the pursuit of a "good" conversion rate has long been plagued by guesswork, vanity metrics, and one-size-fits-all assumptions. However, a landmark data analysis released by Unbounce sheds empirical light on the mechanics of online lead generation and conversion rate optimization (CRO). Drawing from an exhaustive dataset encompassing over 57 million conversions, 41,000 distinct landing pages, and a staggering 464 million pageviews, the 2024 Conversion Benchmark Report shatters conventional wisdom regarding what constitutes baseline success.
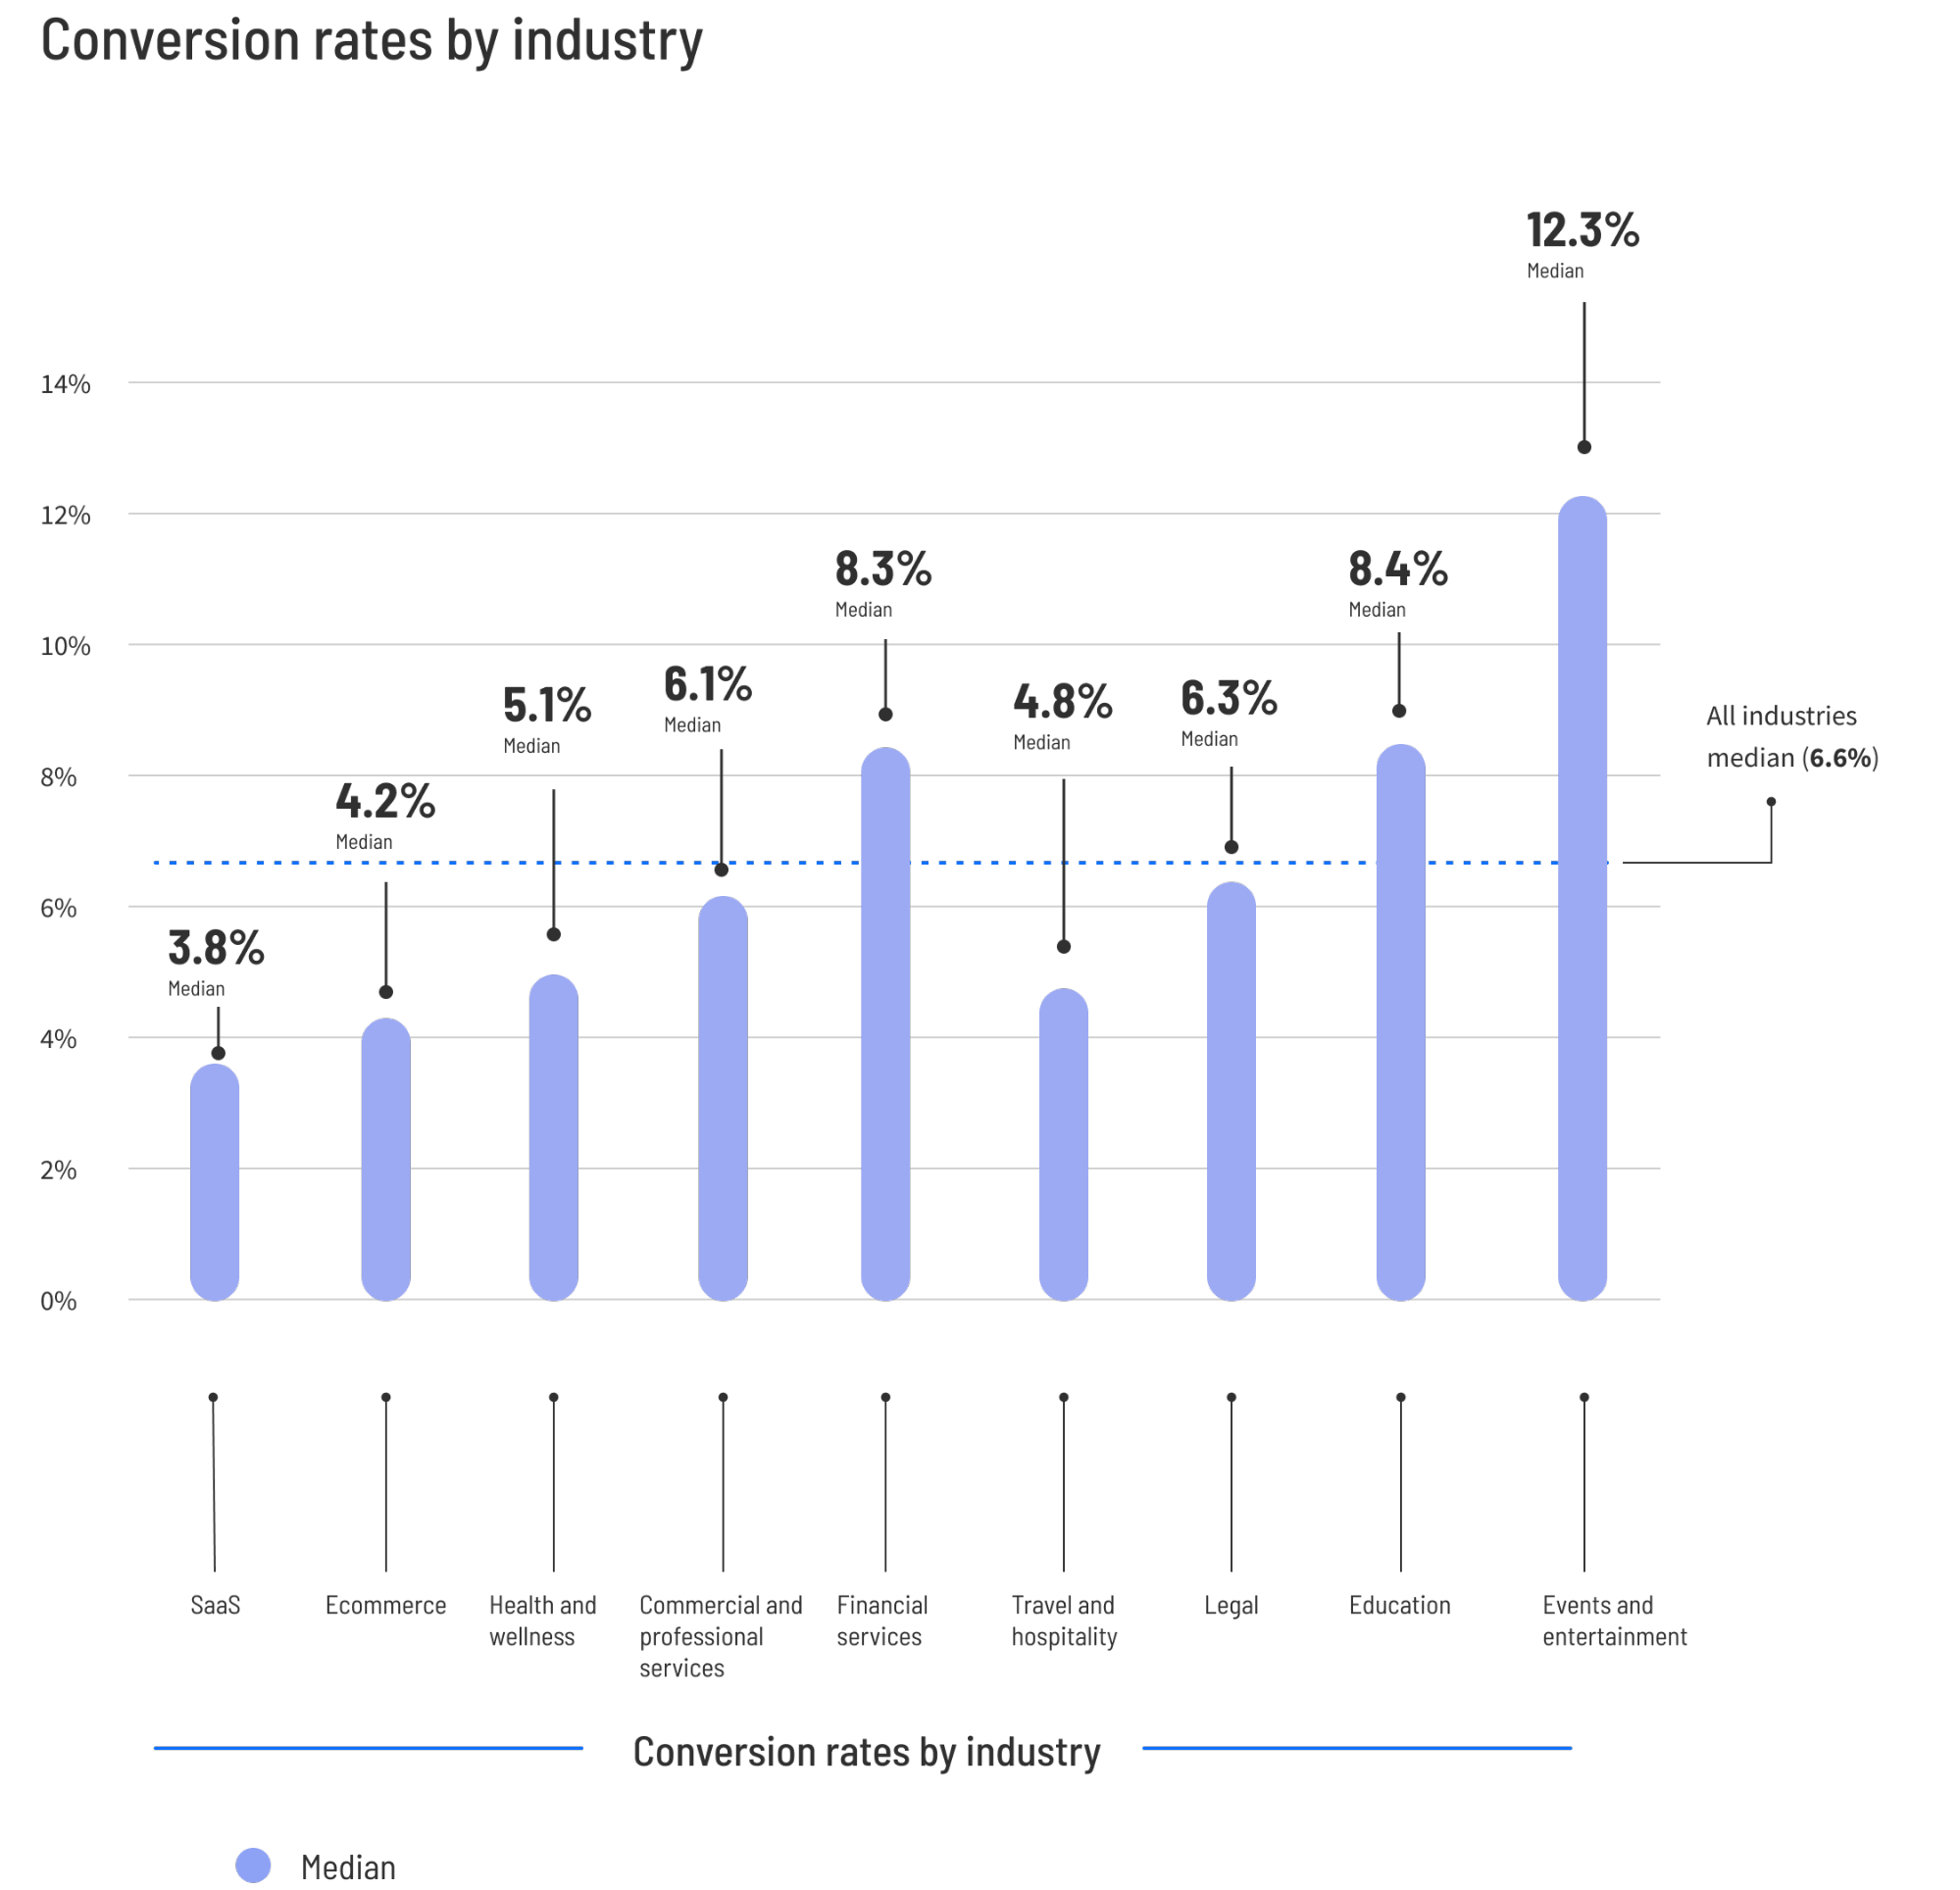
According to the research—compiled and analyzed by digital growth experts like Josh Gallant, founder of Backstage SEO—the median landing page conversion rate across all industries sits at 6.6%. Yet, treating this figure as a universal performance target is a fundamental strategic error. Conversion rates are deeply contextual, fluctuating wildly based on industry verticals, user intent, device distribution, and traffic acquisition channels.

While the median provides a stable middle-of-the-pack reference point, elite performance—defined as the 75th percentile floor—starts at 11.4% and can soar as high as 40.8%. This comprehensive report investigates the underlying variables driving these performance gaps, dissects industry-specific benchmarks, and outlines actionable, data-driven optimization strategies for marketers seeking to maximize return on ad spend (ROAS).
Detailed Chronology and Methodological Shift: Why Medians Matter
To understand the architecture of modern conversion metrics, one must first examine the statistical methodology utilized in the Unbounce benchmark analysis. Historically, digital marketing literature has relied heavily on arithmetic means (averages) to report performance indicators. However, averages are notoriously susceptible to extreme statistical outliers—such as rogue "unicorn" pages converting at 90% or neglected digital properties struggling at 0.001%.

To illustrate this distortion, consider a classic economic analogy: if a room contains ten standard educators and Jeff Bezos, the average net worth in the room skyrockets into the billions, yet it tells us nothing about the financial reality of the typical person present.
By prioritizing median values rather than averages, the 2024 Conversion Benchmark Report effectively neutralizes these distortions. The median represents the exact midpoint of the dataset, providing marketers with a realistic, achievable baseline that reflects the true middle of the pack. With a sample size exceeding 41,000 landing pages, this median framework ensures that digital strategists can benchmark their performance against genuine peer groups rather than skewed internet folklore.
Supporting Context & Metrics: Industry-by-Industry Breakdown
Context is the ultimate determinant of conversion success. A B2B software-as-a-service (SaaS) provider offering a complex enterprise platform operates in an entirely different universe than an ecommerce retailer running a localized flash sale. Consequently, evaluating performance requires dissecting sector-specific baselines and the top-tier thresholds required to break into the upper quartile of performers.
1. Ecommerce: The High-Volume Balancing Act
- Median Conversion Rate: 4.2%
- Top 25% Performance Threshold: 11.4% (or higher)
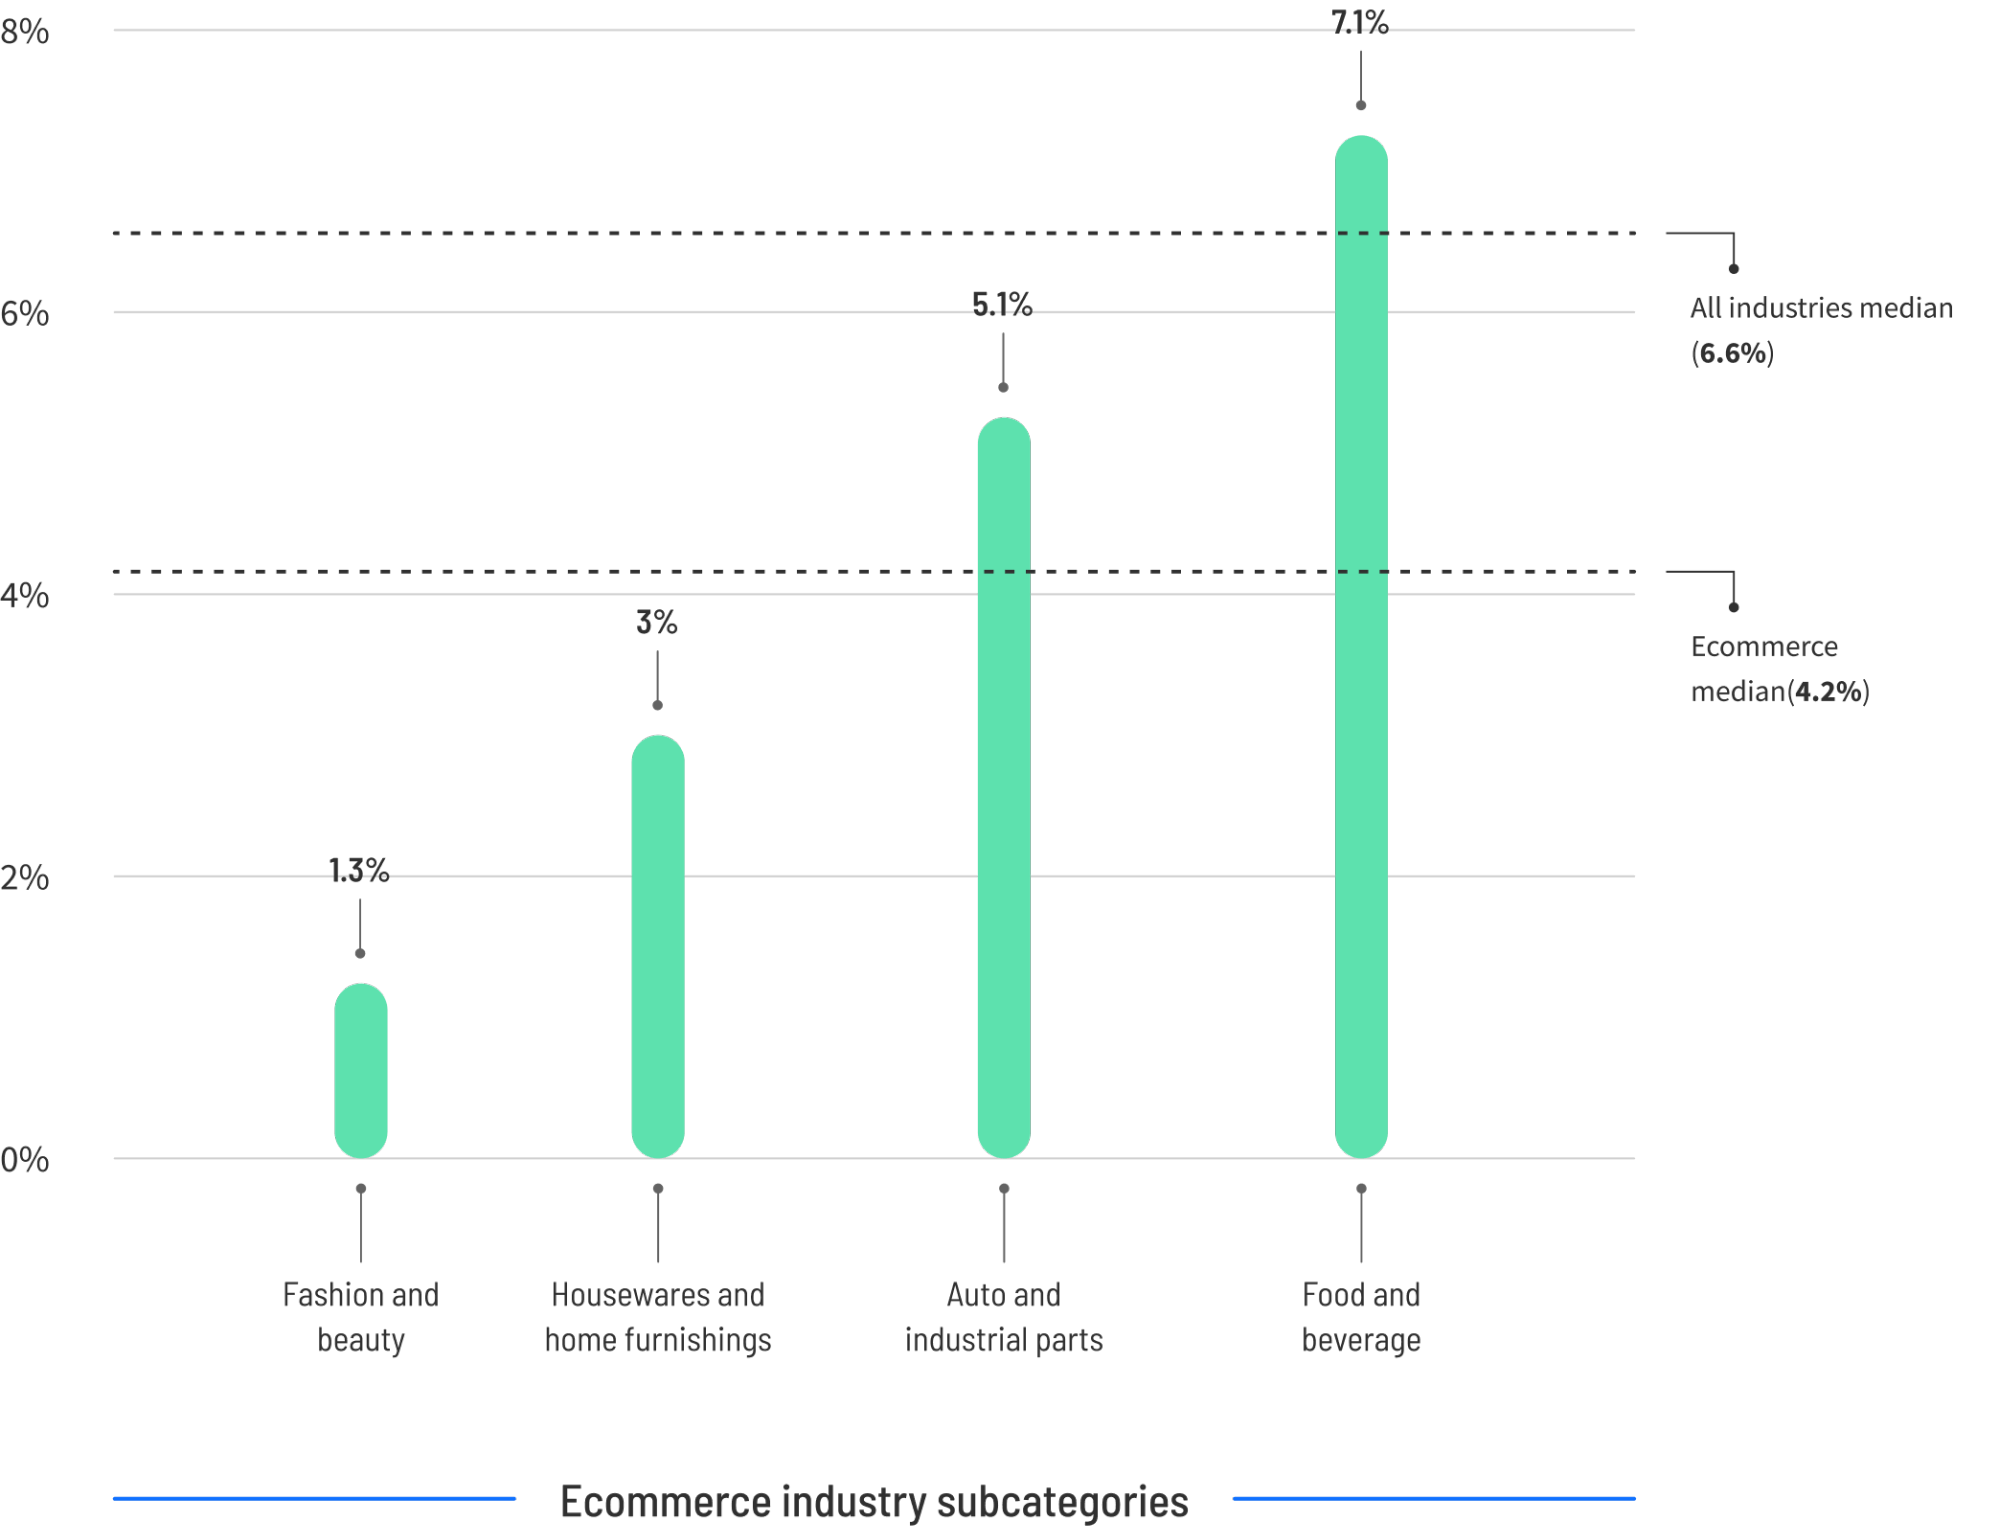
Ecommerce landing pages represent a massive volume of digital transactions, balancing impulse buys against considered purchases. While a 4.2% median rate outpaces half the market, top-tier retailers triple this output, hitting 11.4% or greater. Subcategory nuances are stark: food and beverage pages command a robust 7.1% median, whereas fashion and beauty sectors labor under a much tighter 1.3% median. Driving traffic from a baseline 4.2% to the top-tier 11.4% on 10,000 monthly visitors yields an additional 720 conversions—translating to tens of thousands in incremental monthly revenue.
2. Software-as-a-Service (SaaS): Navigating Long Sales Cycles
- Median Conversion Rate: 3.8%
- Top 25% Performance Threshold: 11.6% (or higher)
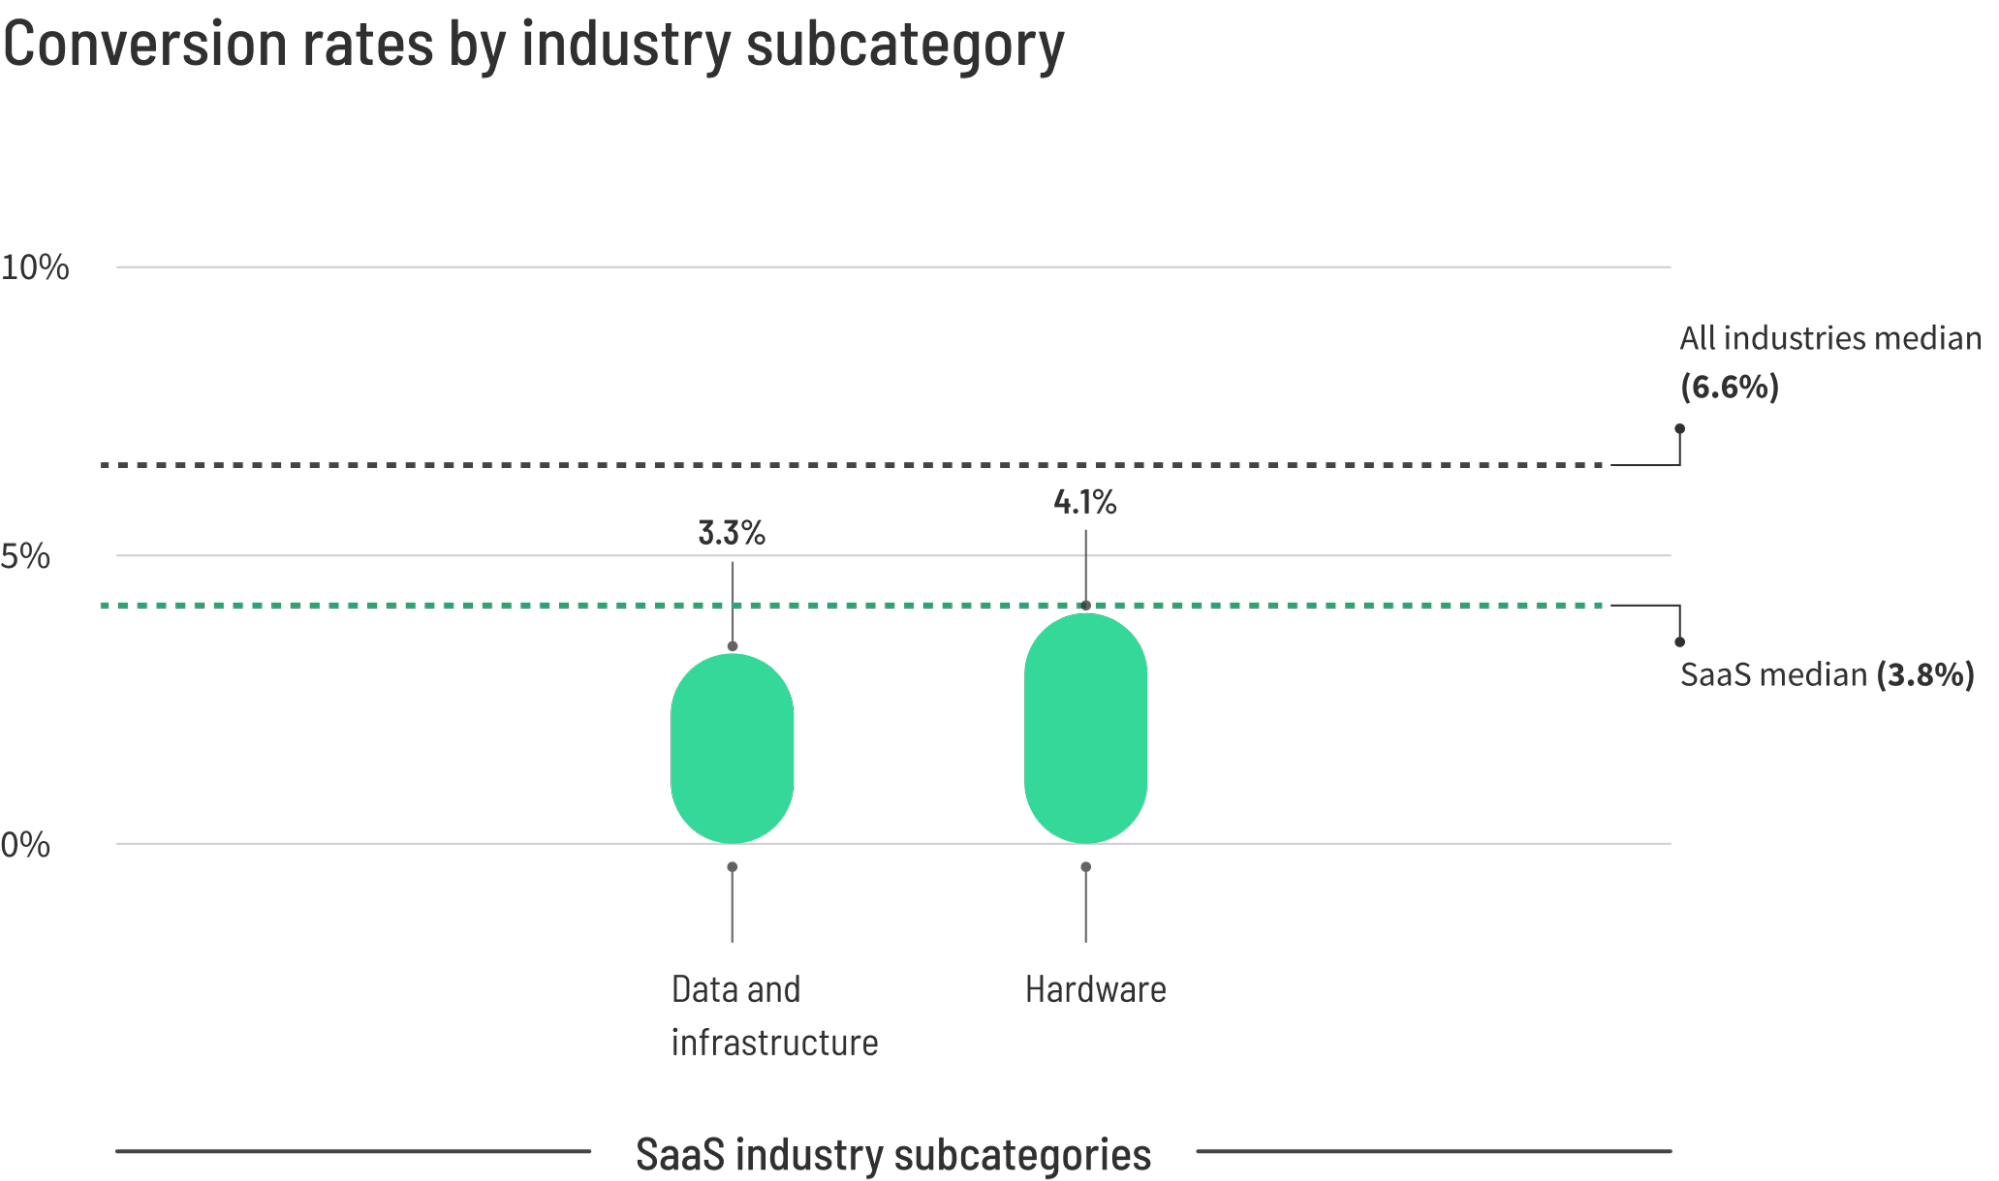
Sitting below the all-industry median, SaaS landing pages face inherent friction. They promote complex, intangible products characterized by extended consideration periods and audiences with wildly divergent buying intent. A visitor clicking a SaaS ad may range from a casual researcher to an executive ready to pilot a trial. Notably, hardware-focused SaaS offerings perform slightly better (4.1% median) than data and infrastructure solutions (3.3% median). Elite SaaS performers bridge this gap by ruthlessly refining pain-point messaging and removing adoption barriers via frictionless trials.
3. Professional Services: The Power of Intent and Traffic Quality
- Median Conversion Rate: 6.1%
- Top 25% Performance Threshold: 14.1% (or higher)
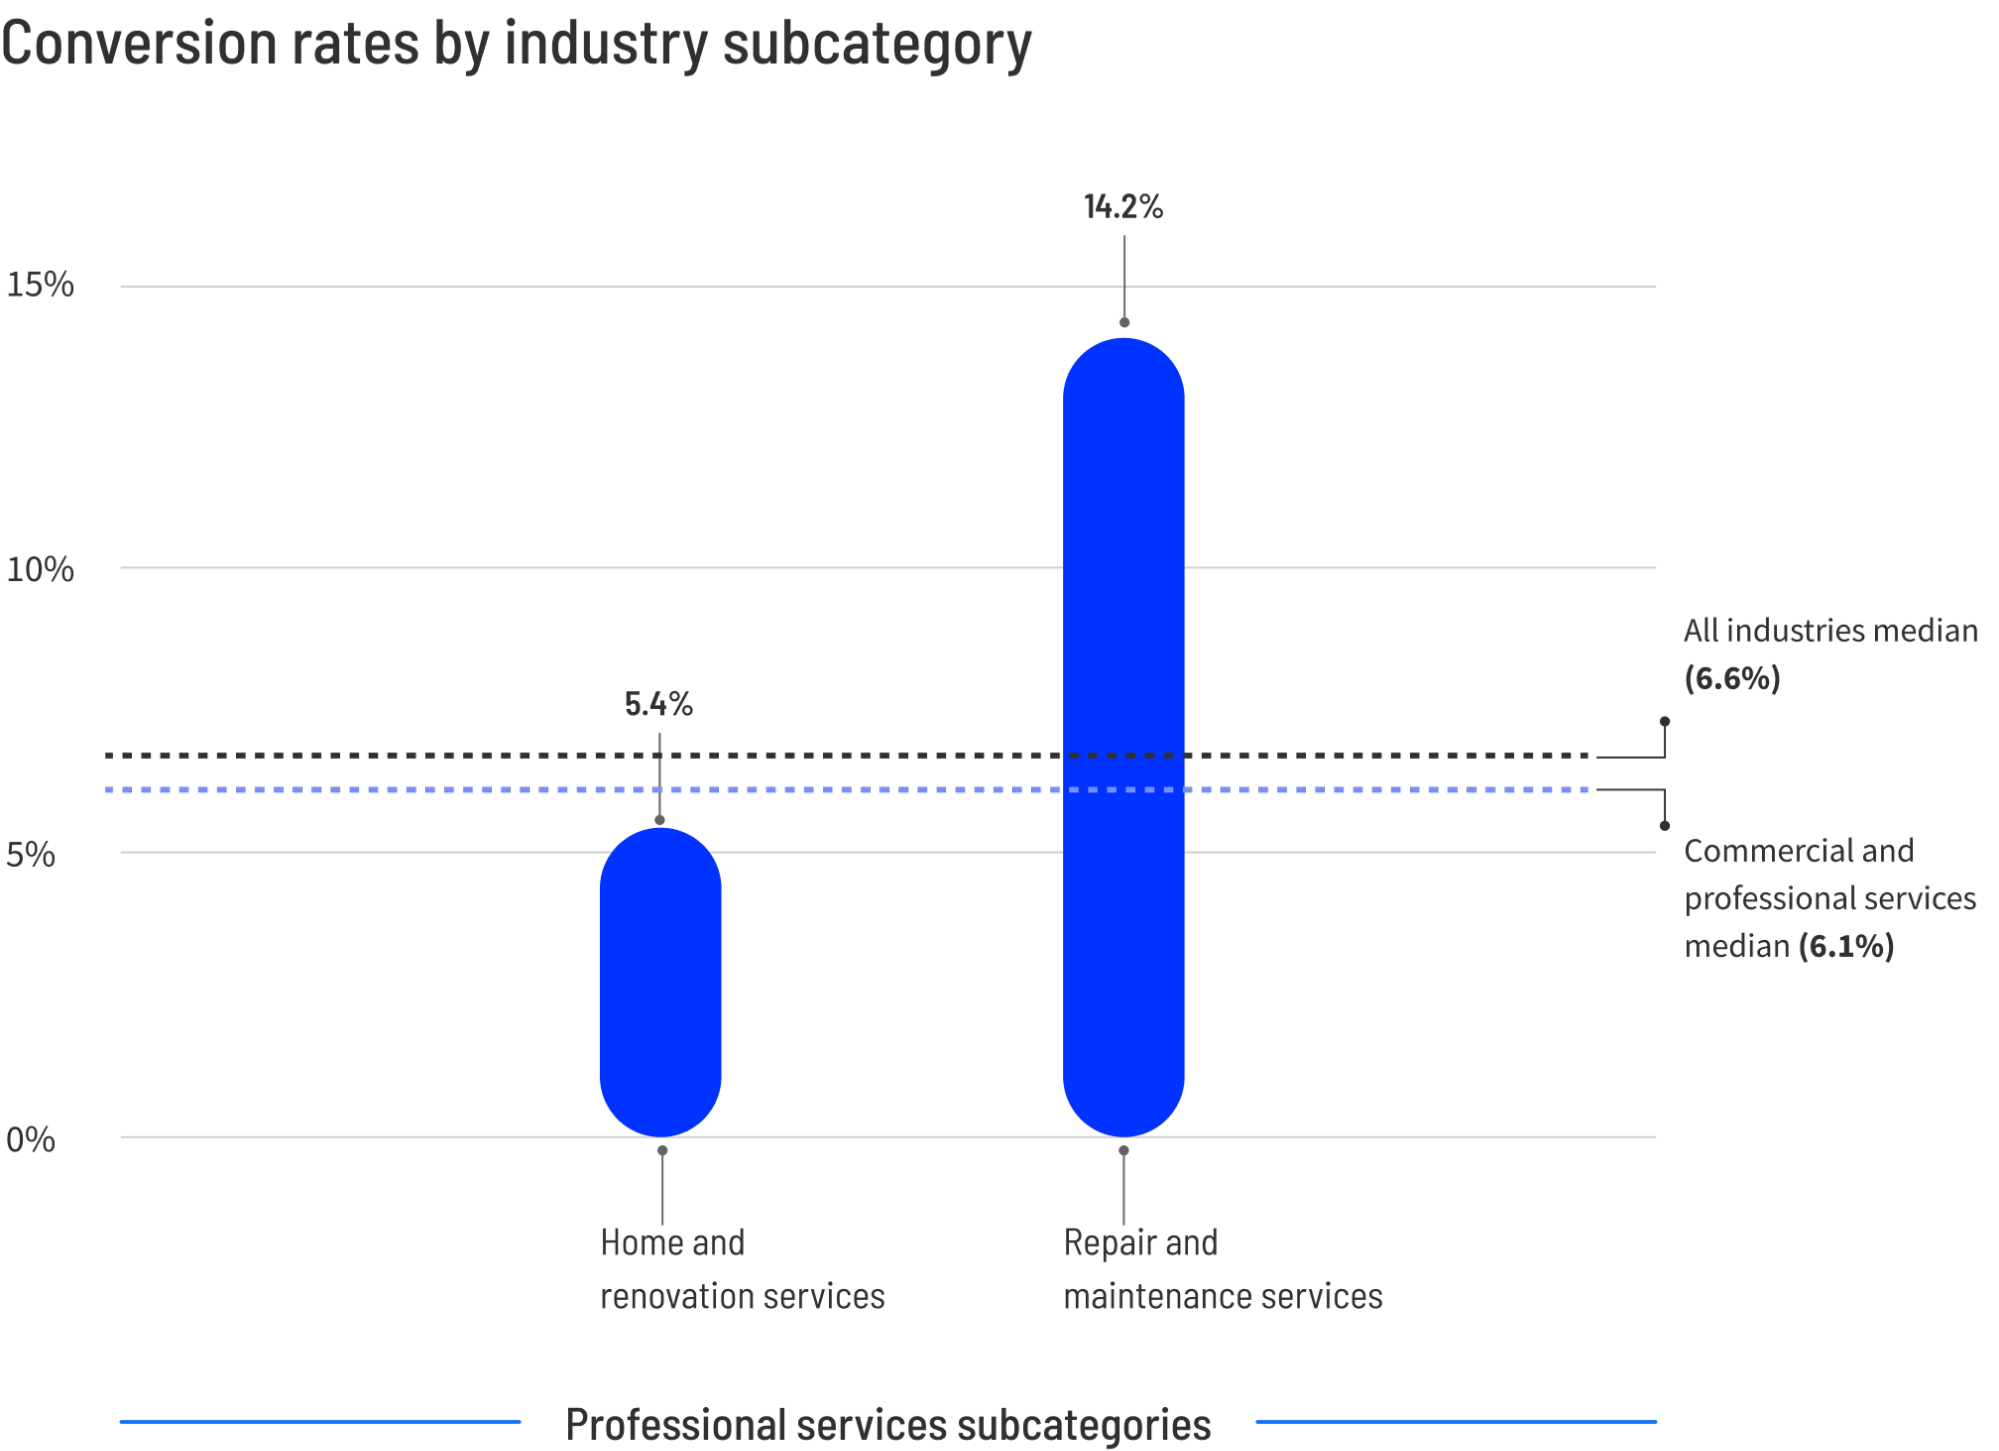
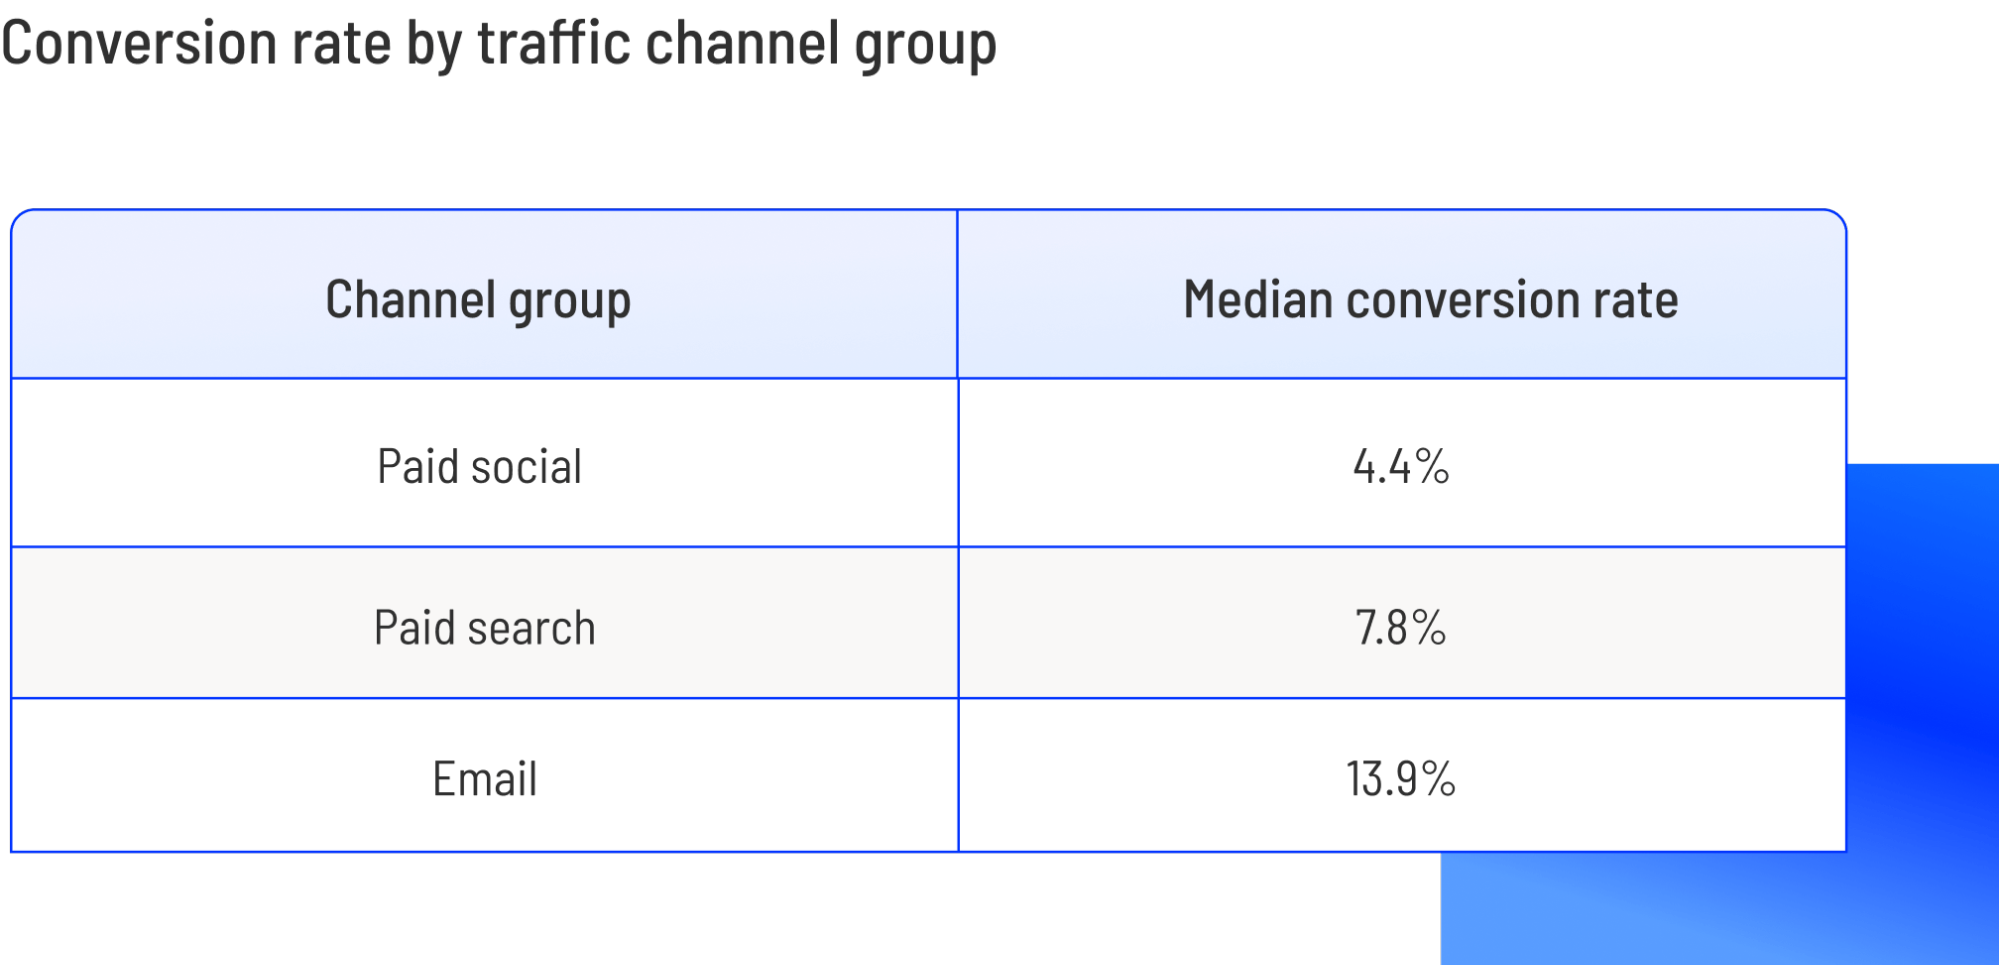
Encompassing legal, consulting, and home renovation services, professional services exhibit dramatic internal variance. For instance, urgent repair and maintenance pages convert nearly three times better than long-term renovation pages. Crucially, this sector underscores the vital impact of traffic channels: email marketing campaigns convert at a stellar ~14%, while paid social channels lag at 4.4%. Organizations reaching the 14.1% top-tier threshold succeed by aligning high-trust copywriting with targeted, high-intent audience nurturing.
4. Financial Services and Insurance: High Stakes, Mobile Dominance
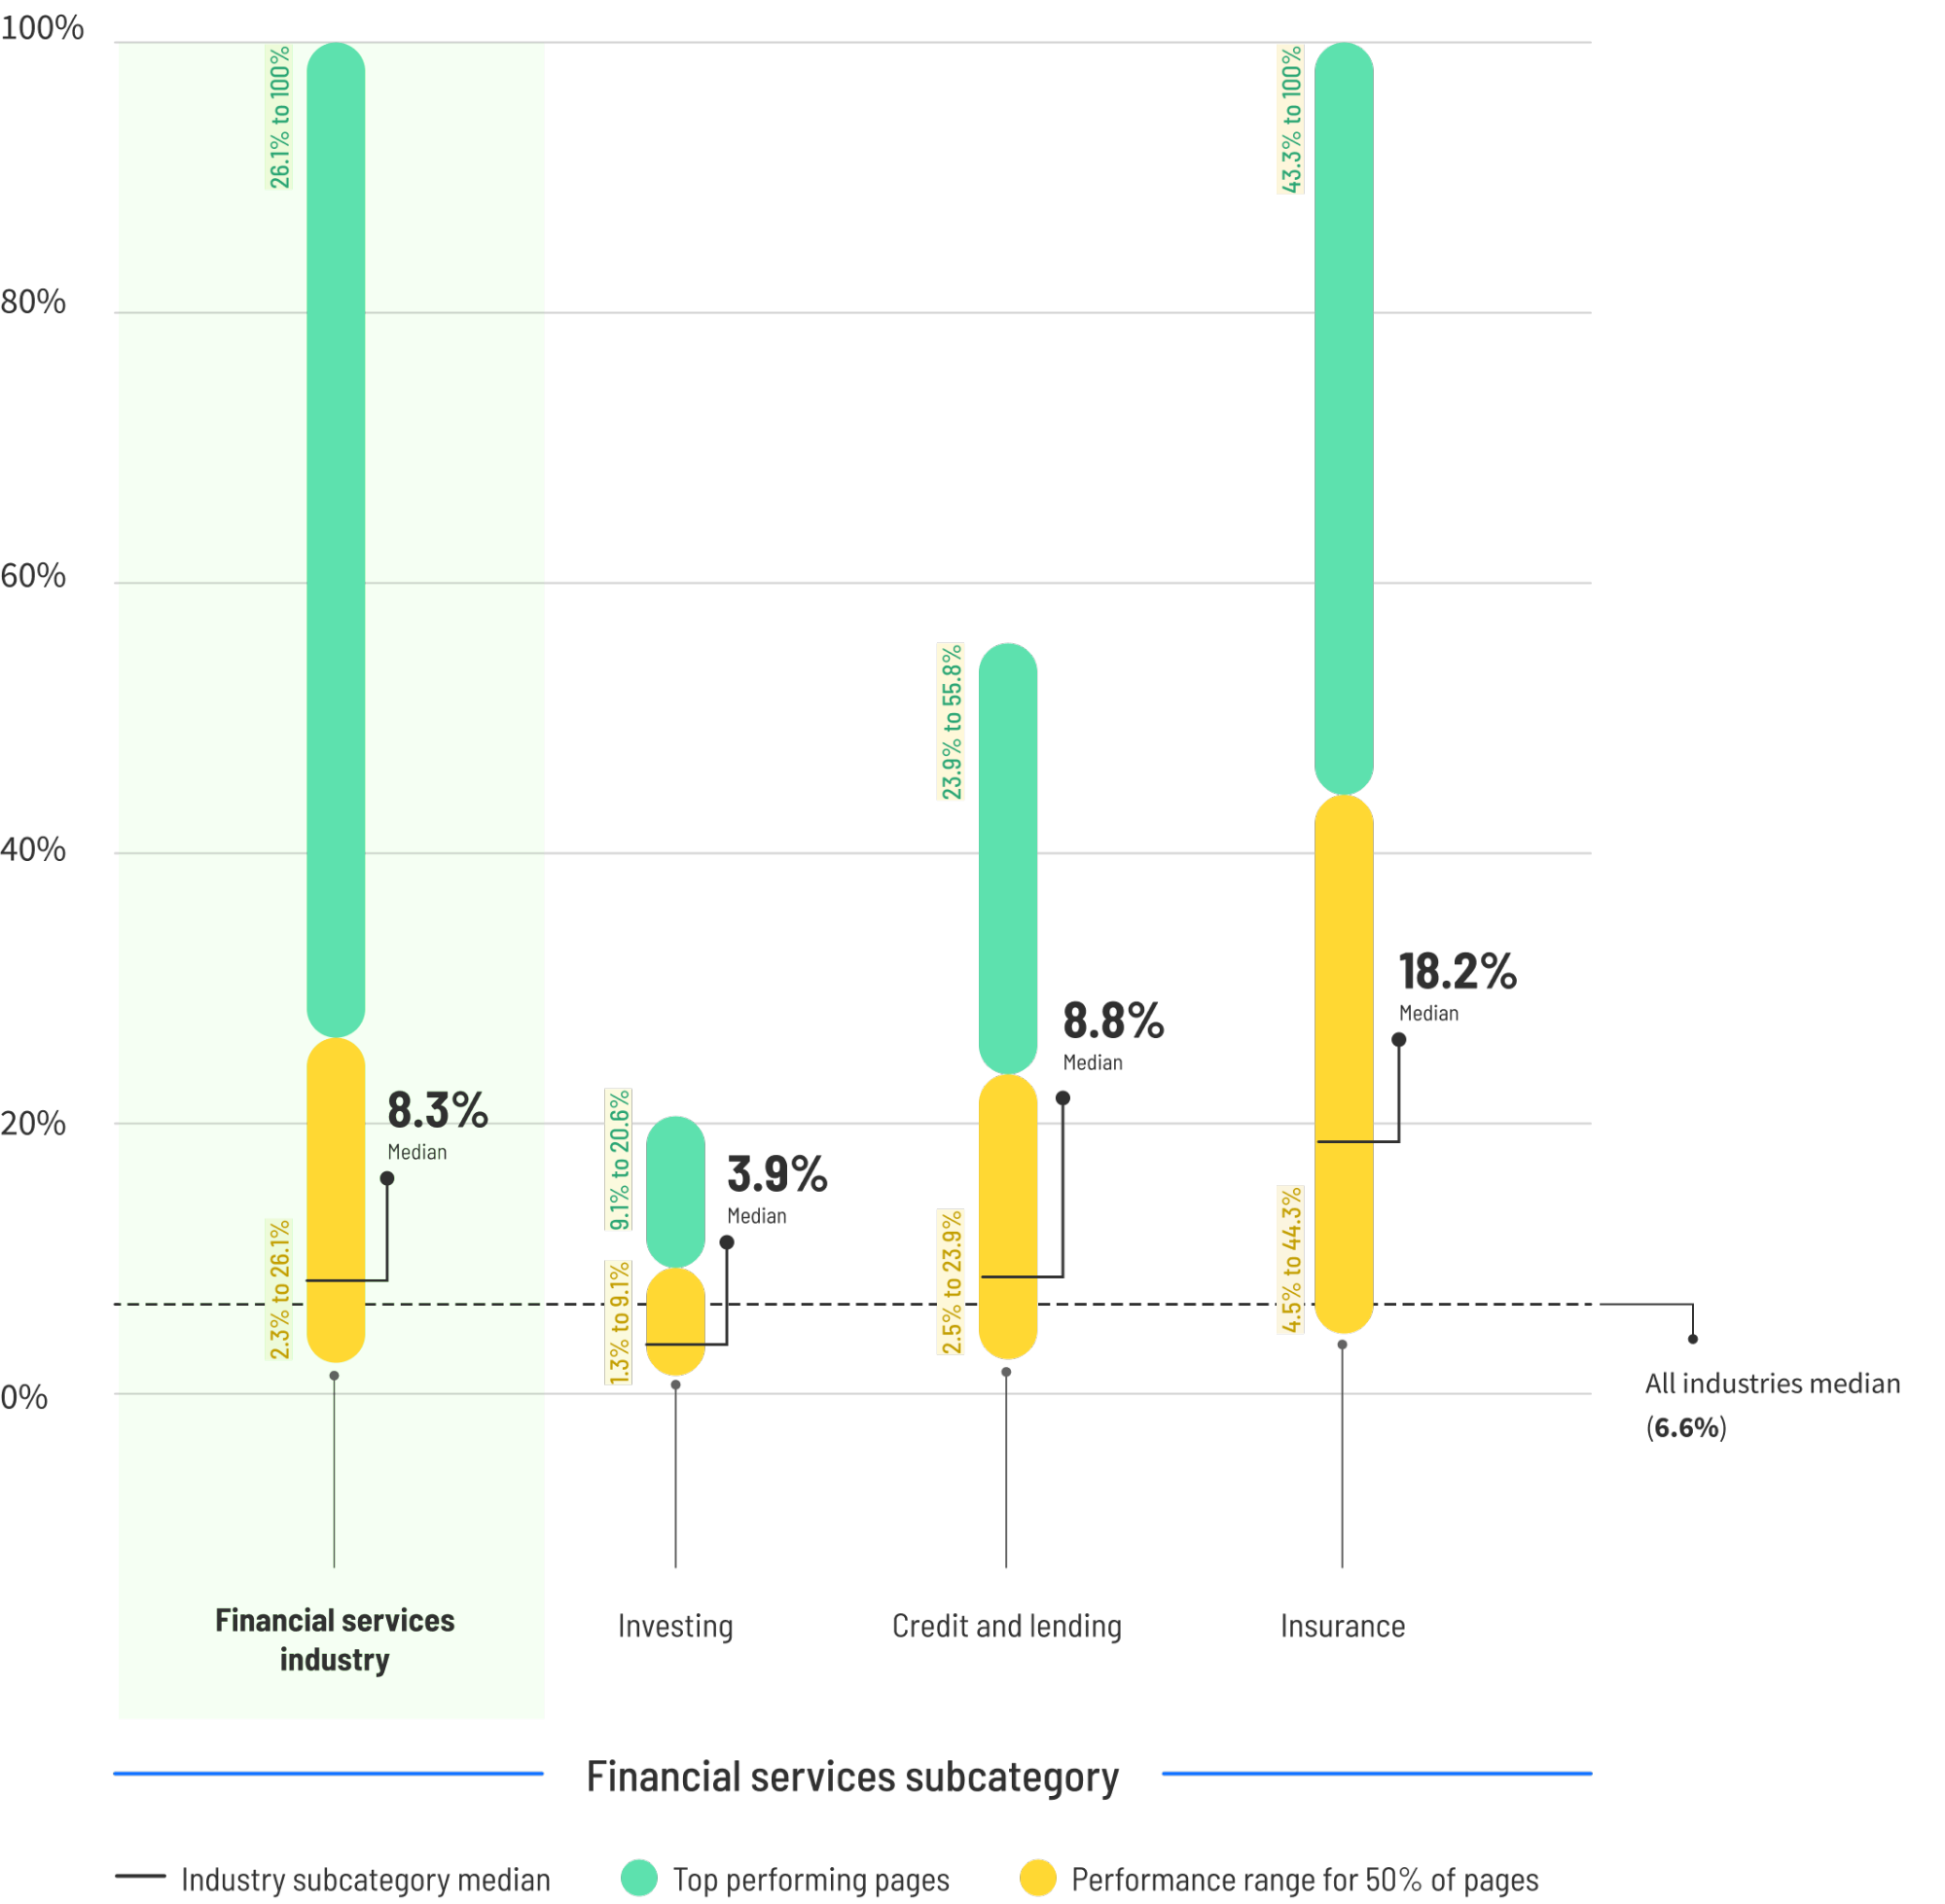
- Median Conversion Rate: 8.3%
- Top 25% Performance Threshold: Varies significantly by subcategory (Insurance peaks heavily)
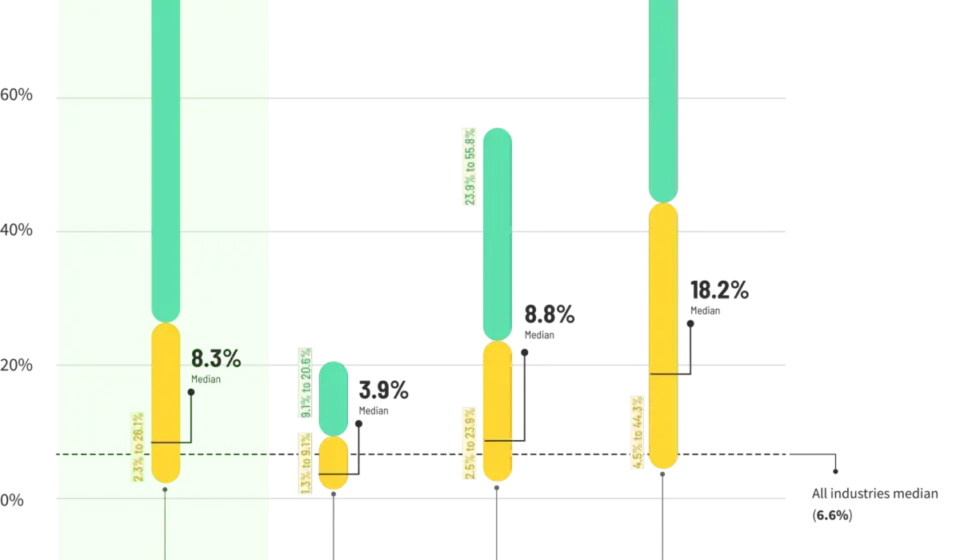
Driven by high user intent, financial services comfortably outpace the cross-industry median. Insurance pages dominate within the sector at an 18.2% median, while investment pages settle at 3.9%. A fascinating anomaly surfaces in device behavior: unlike most industries where desktop rules, financial services mobile traffic converts 27.8% better than desktop, highlighting the critical need for mobile-first user experience design in regulated finance.
5. Travel and Hospitality: The Consideration Paradox
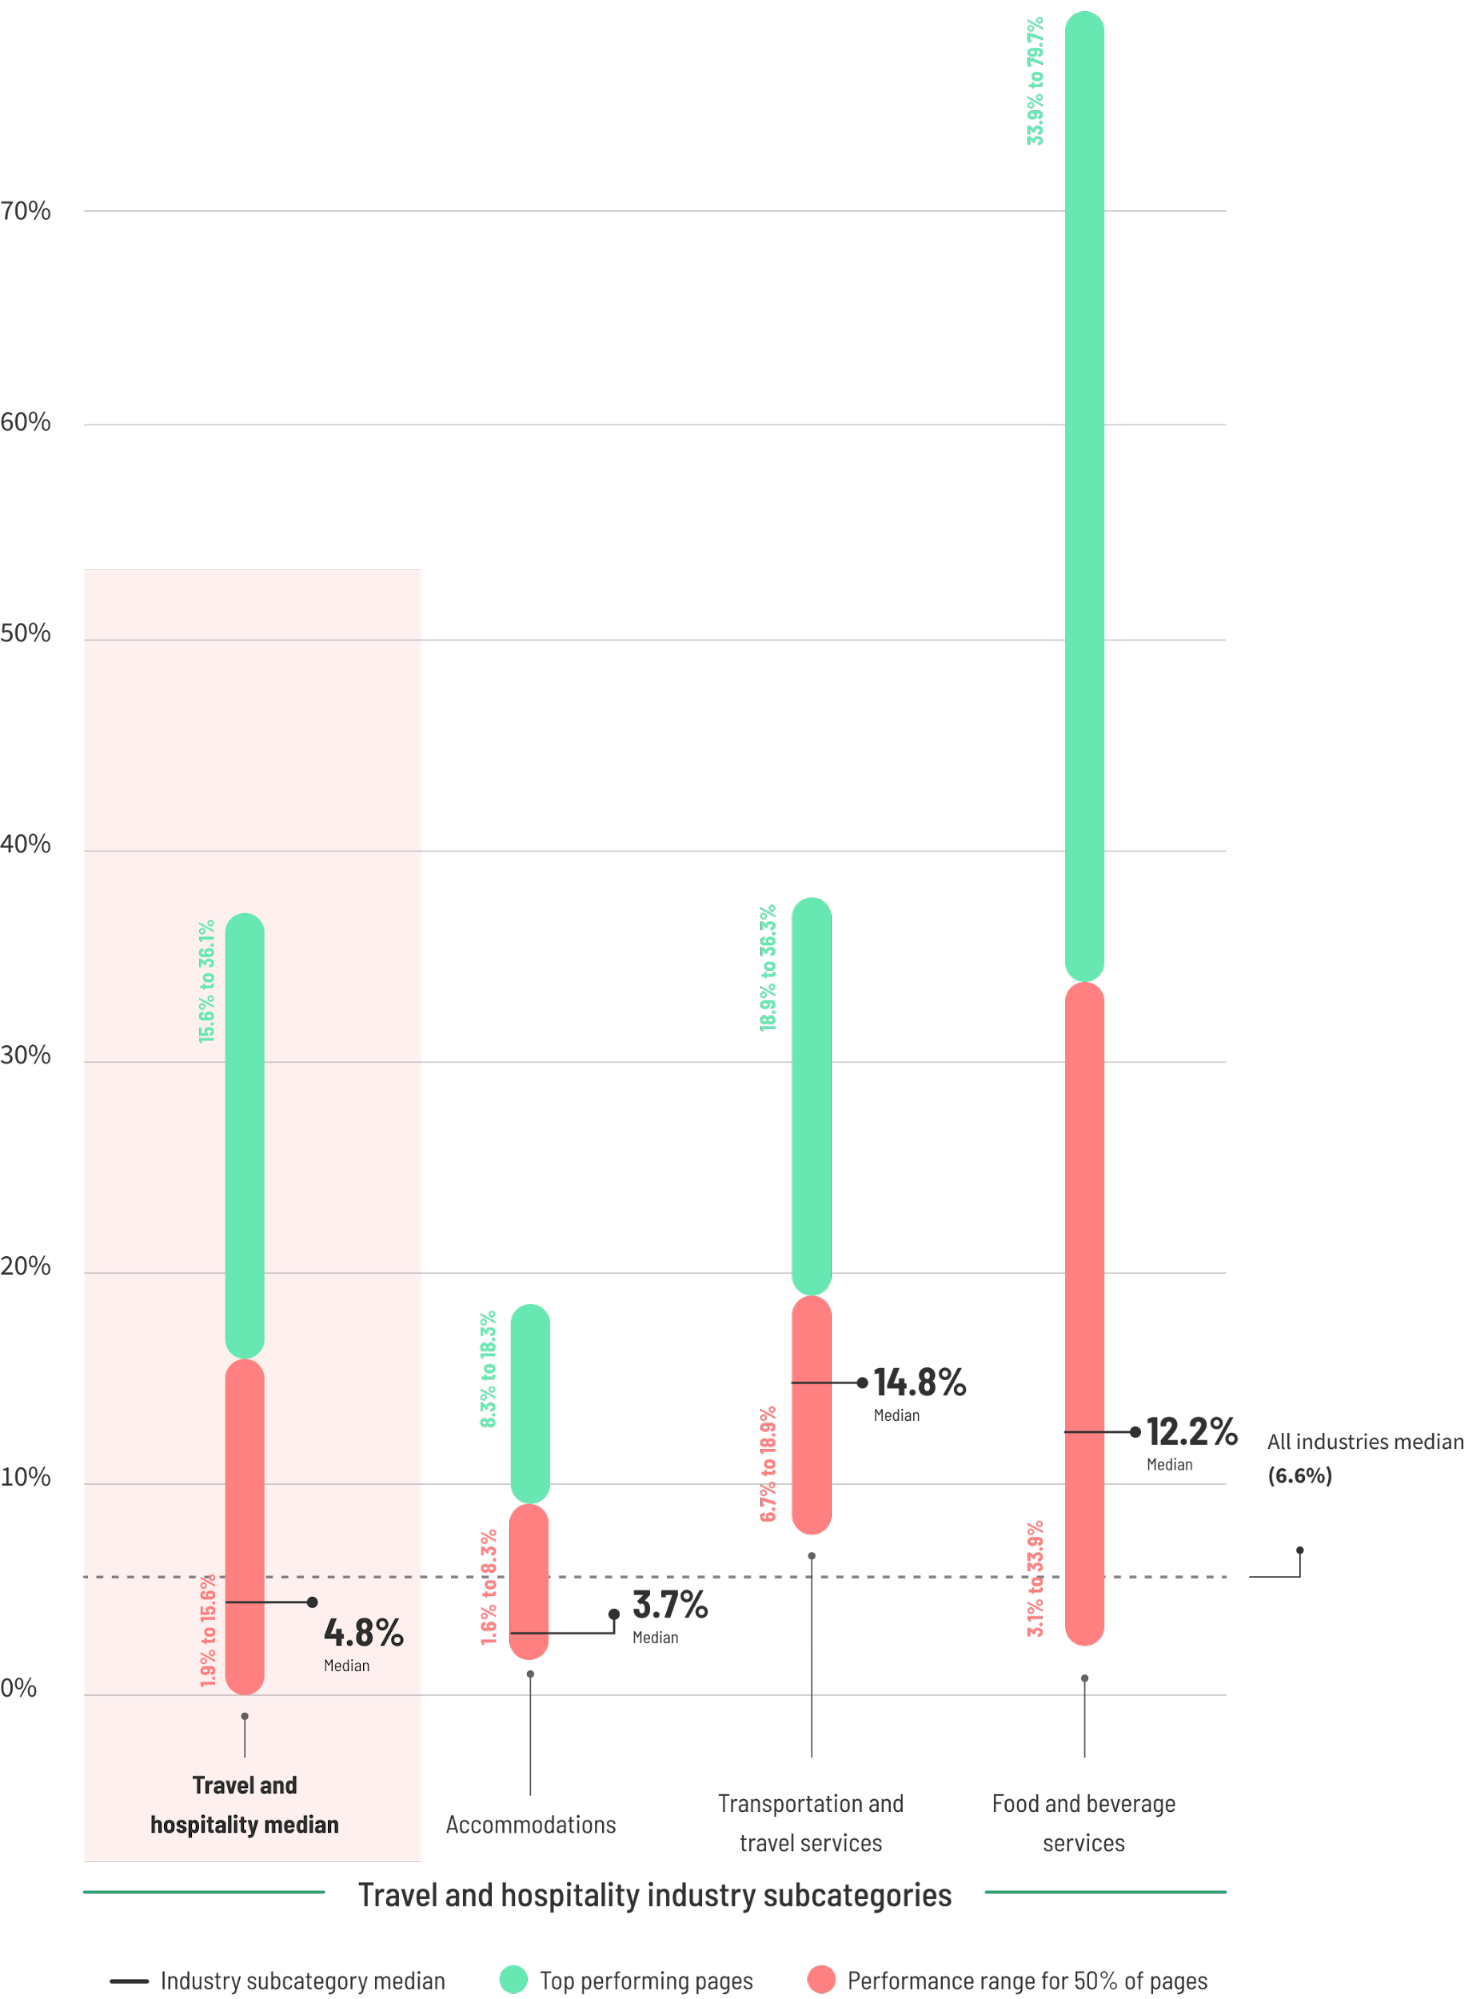
- Median Conversion Rate: 4.8%
- Top 25% Performance Threshold: 15.6% (or higher)
Hospitality pages sit 37% below the cross-industry median. Accommodations (hotels, rentals) struggle at a 3.7% median due to heavy comparison shopping, whereas transportation services surge to 14.8% driven by time-sensitive urgency. Furthermore, travel booking behavior heavily favors desktop for final transactions, with desktop traffic converting 10.4% better than mobile despite heavy mobile research habits.
6. Legal Services: High Urgency on Small Screens
- Median Conversion Rate: 6.3%
- Top 25% Performance Threshold: 13.1% (or higher)
Legal landing pages flip conventional wisdom on its head: mobile traffic converts at 21% compared to 15.9% on desktop. This surge reflects acute consumer distress—individuals searching for counsel following accidents or legal notices via mobile devices. Paid search traffic similarly dominates, converting nearly twice as well as alternative channels as users frantically search for local legal representation.
7. Education and Online Learning: Selling Transformation
- Median Conversion Rate: Varies widely (Online courses lead at 18.3%)
- Top 25% Performance Threshold: 20.0% (or higher)
Education marketers reap the rewards of offering immediate, tangible transformations. While higher education sits at a 6.3% median, online course landing pages achieve an extraordinary 18.3% median. By selling career advancement and rapid skill acquisition rather than abstract academic concepts, top-tier education pages capture elite conversion levels, heavily supported by email marketing channels converting at 14.1%.
8. Entertainment and Sweepstakes: The Outlier Effect
- Median Conversion Rate: Skewed high by low-friction actions
- Top 25% Performance Threshold: 40.8% (or higher)
Entertainment sectors feature sweeping statistical highs, led by sweepstakes landing pages boasting a staggering 47.5% median conversion rate (reaching up to 79.8% for top performers). This massive anomaly is a direct result of low-friction conversion actions, such as a single email submission or "Enter Now" click, contrasting sharply with complex transactional commitments.
Official Insights & Expert Analysis
Analyzing the anatomy of high-performing landing pages reveals that success is rarely a byproduct of aesthetic luck; it is engineered through systematic optimization. Industry experts emphasize that bridging the gap between average performance and top-tier execution requires adherence to core foundational pillars:
- Radical Readability (The 5th-7th Grade Rule): Data from the Unbounce report confirms that pages written at a 5th-7th grade reading level convert at 11.1%—outperforming 8th-9th grade copy by 56% and more than doubling the conversion rate of dense, "professional" corporate jargon. Simplifying sentence structures and eliminating industry buzzwords directly correlates with improved comprehension and conversion velocity.
- Aggressive Friction Reduction: Top-tier performers audit their conversion paths continuously. By streamlining form fields, optimizing button microcopy, and removing competing navigation links, brands ensure that user attention remains strictly funneled toward the primary Call to Action (CTA).
- Strategic Social Proof Placement: Consumer trust cannot be outsourced to the bottom footer of a page. High-converting properties integrate authentic testimonials, verifiable review counts, and client trust badges directly adjacent to conversion touchpoints.
Future Outlook: The Evolution of CRO and Smart Optimization
As digital acquisition costs rise and privacy regulations complicate audience tracking, the margin for error in landing page design continues to shrink. Organizations can no longer rely on static web pages or generalized marketing playbooks inherited from past decades.
The future of conversion rate optimization belongs to agile, data-literate teams that embrace automated intelligence alongside rigorous human experimentation. Tools leveraging machine learning—such as automated traffic-routing algorithms that dynamically direct visitors to their statistically highest-converting page variants—are rapidly transforming CRO from a manual, guesswork-driven chore into an autonomous, 24/7 revenue engine.
Ultimately, the chasm between average and excellent conversion performance represents a multi-billion-dollar opportunity across the global digital economy. The enterprises capturing this upside are not necessarily those with the largest advertising budgets, but those systematic enough to align visitor intent, linguistic clarity, uncompromising page speed, and continuous A/B testing into a cohesive growth strategy.