In the high-stakes theater of digital marketing, absolute numbers are often deceptive. A 5% conversion rate might be a cause for celebration for a high-end enterprise software vendor, yet represent a catastrophic failure for an e-commerce flash-sale retailer. Yet, despite the ubiquity of conversion rate optimization (CRO) as a discipline, digital marketers have long relied on anecdotal rules of thumb, guessing blindly at what constitutes a "good" performance metric.
To bring empirical rigor to the conversation, Unbounce’s comprehensive 2024 Conversion Benchmark Report shatters generalized assumptions. Drawing on an exhaustive dataset comprising over 57 million conversions, 41,000 distinct landing pages, and 464 million pageviews, the report paints a vivid, granular picture of modern digital consumer behavior.
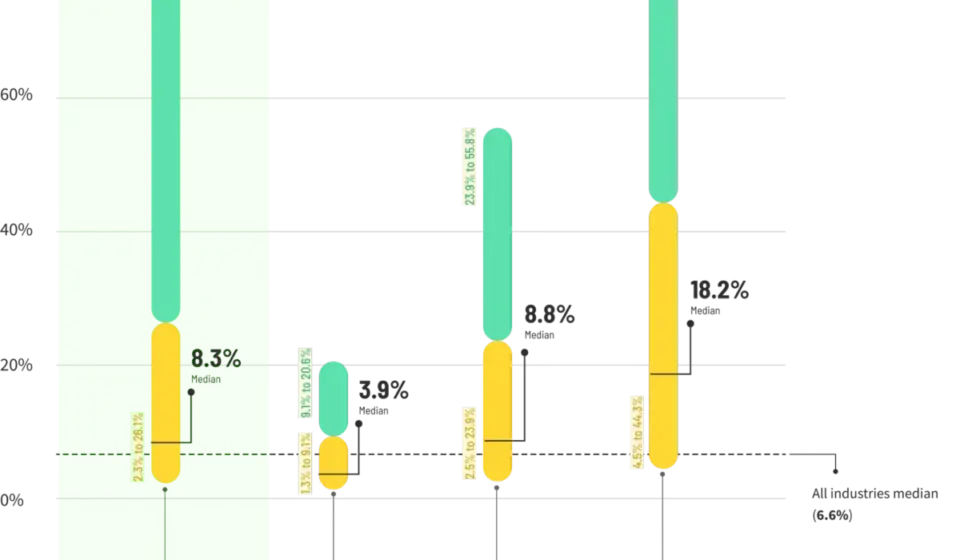
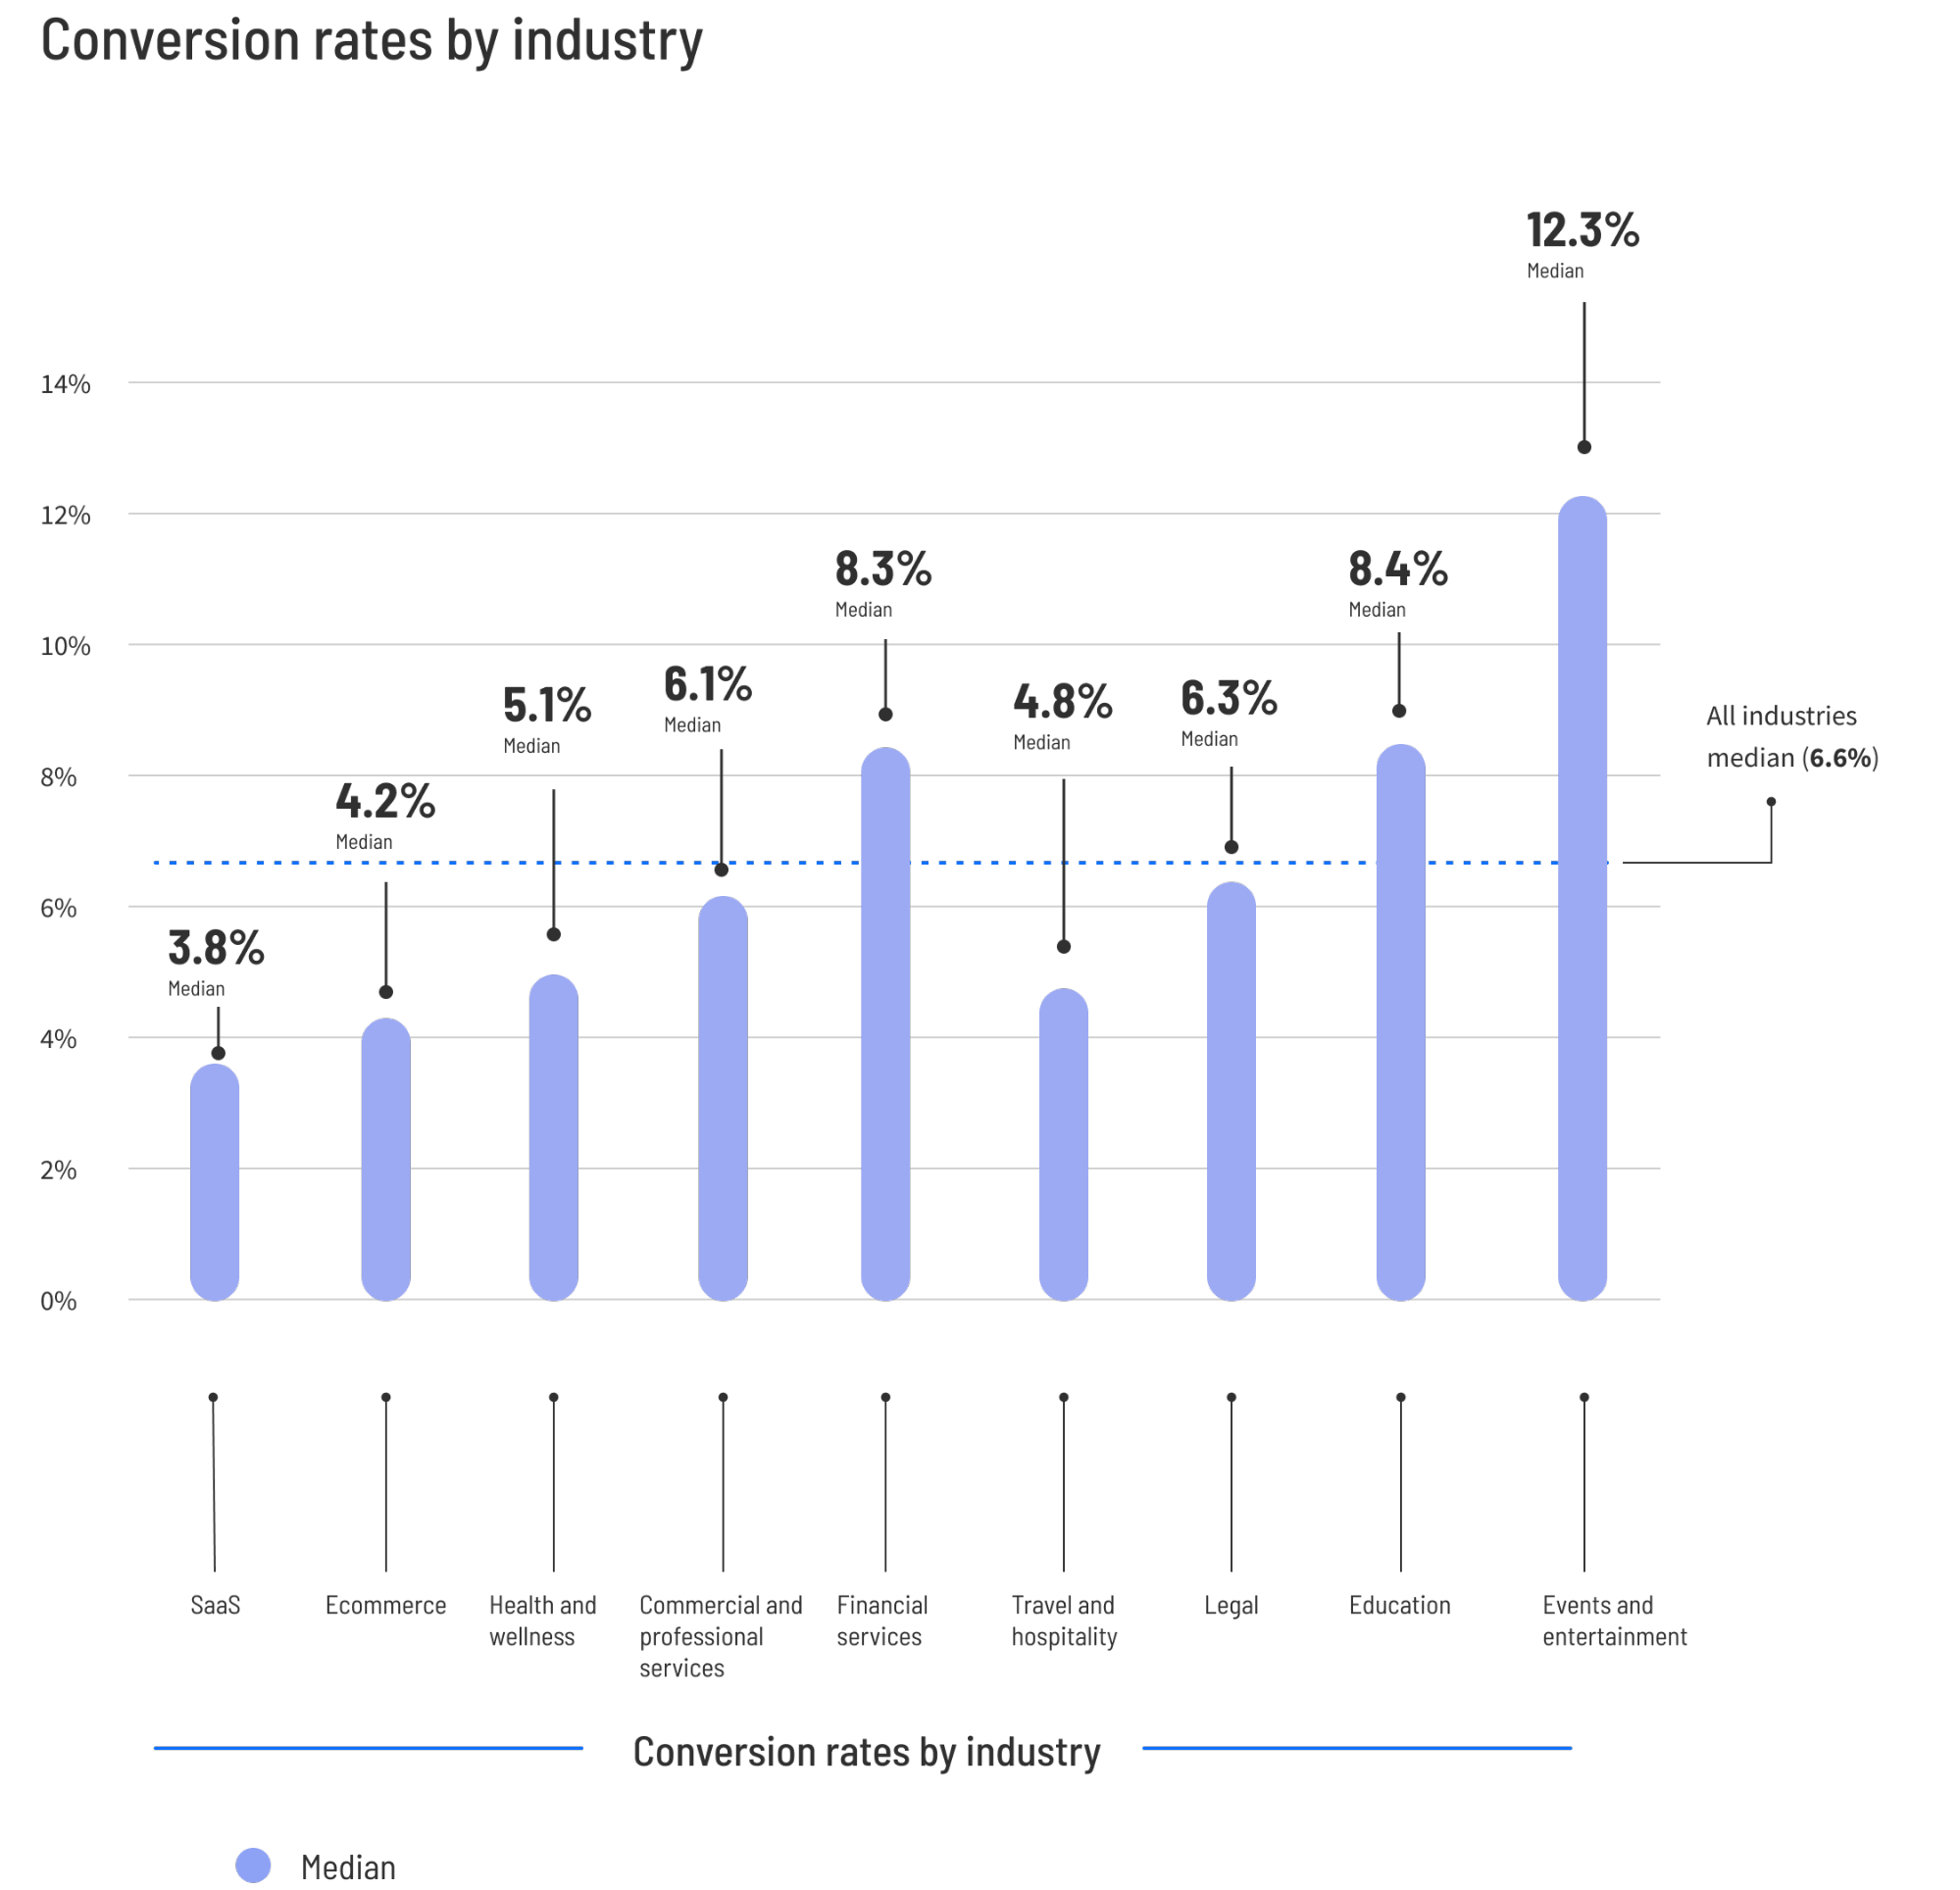
The headline figure—a median landing page conversion rate of 6.6% across all industries—serves as a rudimentary baseline, but it masks profound structural variations. Depending on the vertical, traffic channel, and device type, top-tier performance thresholds span a dizzying range, stretching from an impressive 11.4% to a staggering 40.8%.
This report dives deep into the empirical data, breaking down how industry-specific intent, user psychology, and tactical variables dictate success. By examining why medians outperform averages, exploring vertical-by-vertical nuances, and outlining actionable optimization strategies, we uncover the precise mechanisms that separate high-performing marketing campaigns from digital also-rans.
Detailed Chronology & Data Scope: Behind the Numbers
The modern landscape of digital conversion tracking is fraught with noise. Rare "unicorn" pages boasting 90% conversion rates—often simple email confirmations or internal routing pages—frequently distort standard arithmetic averages. Conversely, poorly optimized or abandoned landing pages converting at 0.001% drag those averages down, leaving marketers with metrics that fail to reflect reality.
To overcome this analytical trap, the researchers behind the 2024 Benchmark Report relied on medians rather than averages.
The Methodology of the Median
When evaluating human metrics, medians provide a truer reflection of the typical experience. If a room contains ten teachers and a billionaire, the average income suggests everyone is fabulously wealthy, while the median reveals the true financial baseline. By analyzing a dataset of over 41,000 landing pages, the Unbounce methodology filters out statistical anomalies, establishing a dependable middle-of-the-pack benchmark.
Evolution of Digital Intent
Over the past decade, landing page optimization has shifted from a tactical afterthought—typically centered on color theory and button placement—to a sophisticated architectural science. As digital advertising costs (CPC and CPM) have climbed across major channels like Google Ads and Meta, the margin for error has narrowed.
Consumers today exhibit higher skepticism, shorter attention spans, and greater reliance on mobile devices. Consequently, landing pages can no longer rely on generic value propositions. The data reveals that modern conversion success is inextricably linked to message-to-market match: how seamlessly a page satisfies the precise intent of a user arriving via a specific traffic source, at a specific time, on a specific device.
Supporting Context & Metrics: Industry-by-Industry Deep Dive
Comparing your conversion rate to a generalized internet average is like comparing the price of a luxury sedan to the entire inventory of a supermarket. Context changes everything. Below, we break down the median baselines and the top-tier thresholds (representing the 75th percentile floor required to join the top-performing 25% of pages) across major industries.
1. E-Commerce: Navigating the Product Spectrum
Median Conversion Rate: 4.2%
Top 25% Threshold ("Good"): 11.4% or higher
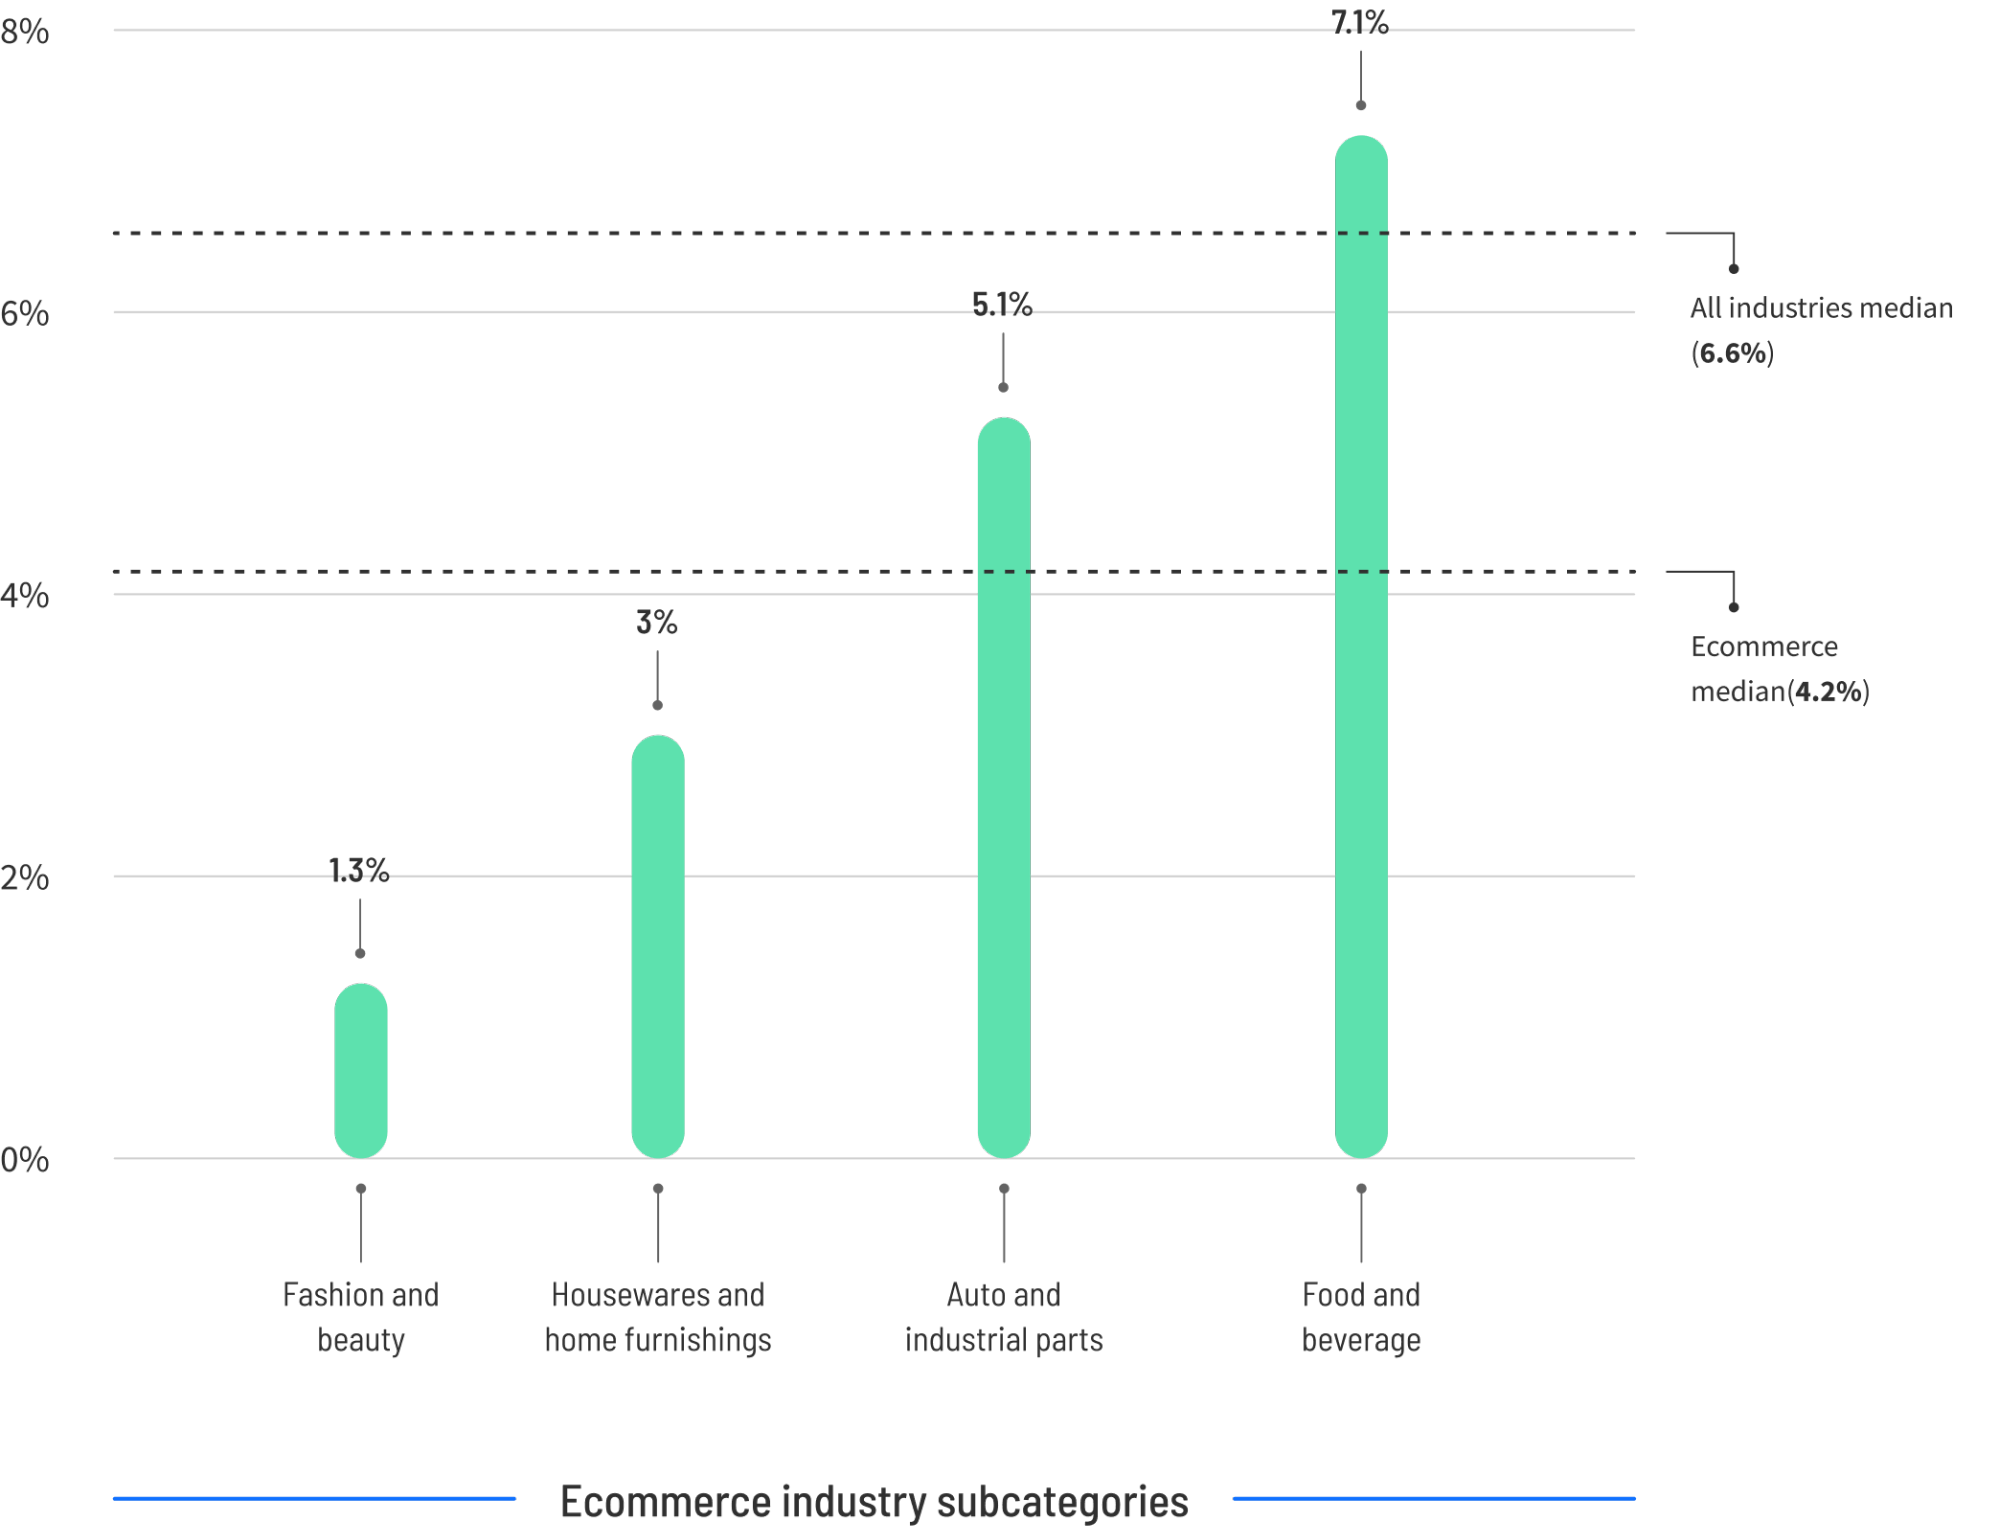
E-commerce landing pages manage a diverse array of campaigns, from flash sales to seasonal promotions. While the median sits at 4.2%, top performers more than double this figure, transforming traffic into revenue at an 11.4% clip.
However, product categories within e-commerce behave erratically. Food and beverage pages enjoy a robust median conversion rate of 7.1%, driven by low commitment and immediate consumer gratification. Conversely, fashion and beauty pages face fierce competition and visual skepticism, registering a median conversion rate of just 1.3%.
The Financial Impact: For a store generating 10,000 monthly visitors, scaling a conversion rate from the median 4.2% to the top-tier 11.4% yields an additional 720 conversions. At an average order value of $75, this shift represents over $54,000 in incremental monthly revenue.
2. SaaS (Software as a Service): The Long-Cycle Challenge
Median Conversion Rate: 3.8%
Top 25% Threshold ("Good"): 11.6% or higher
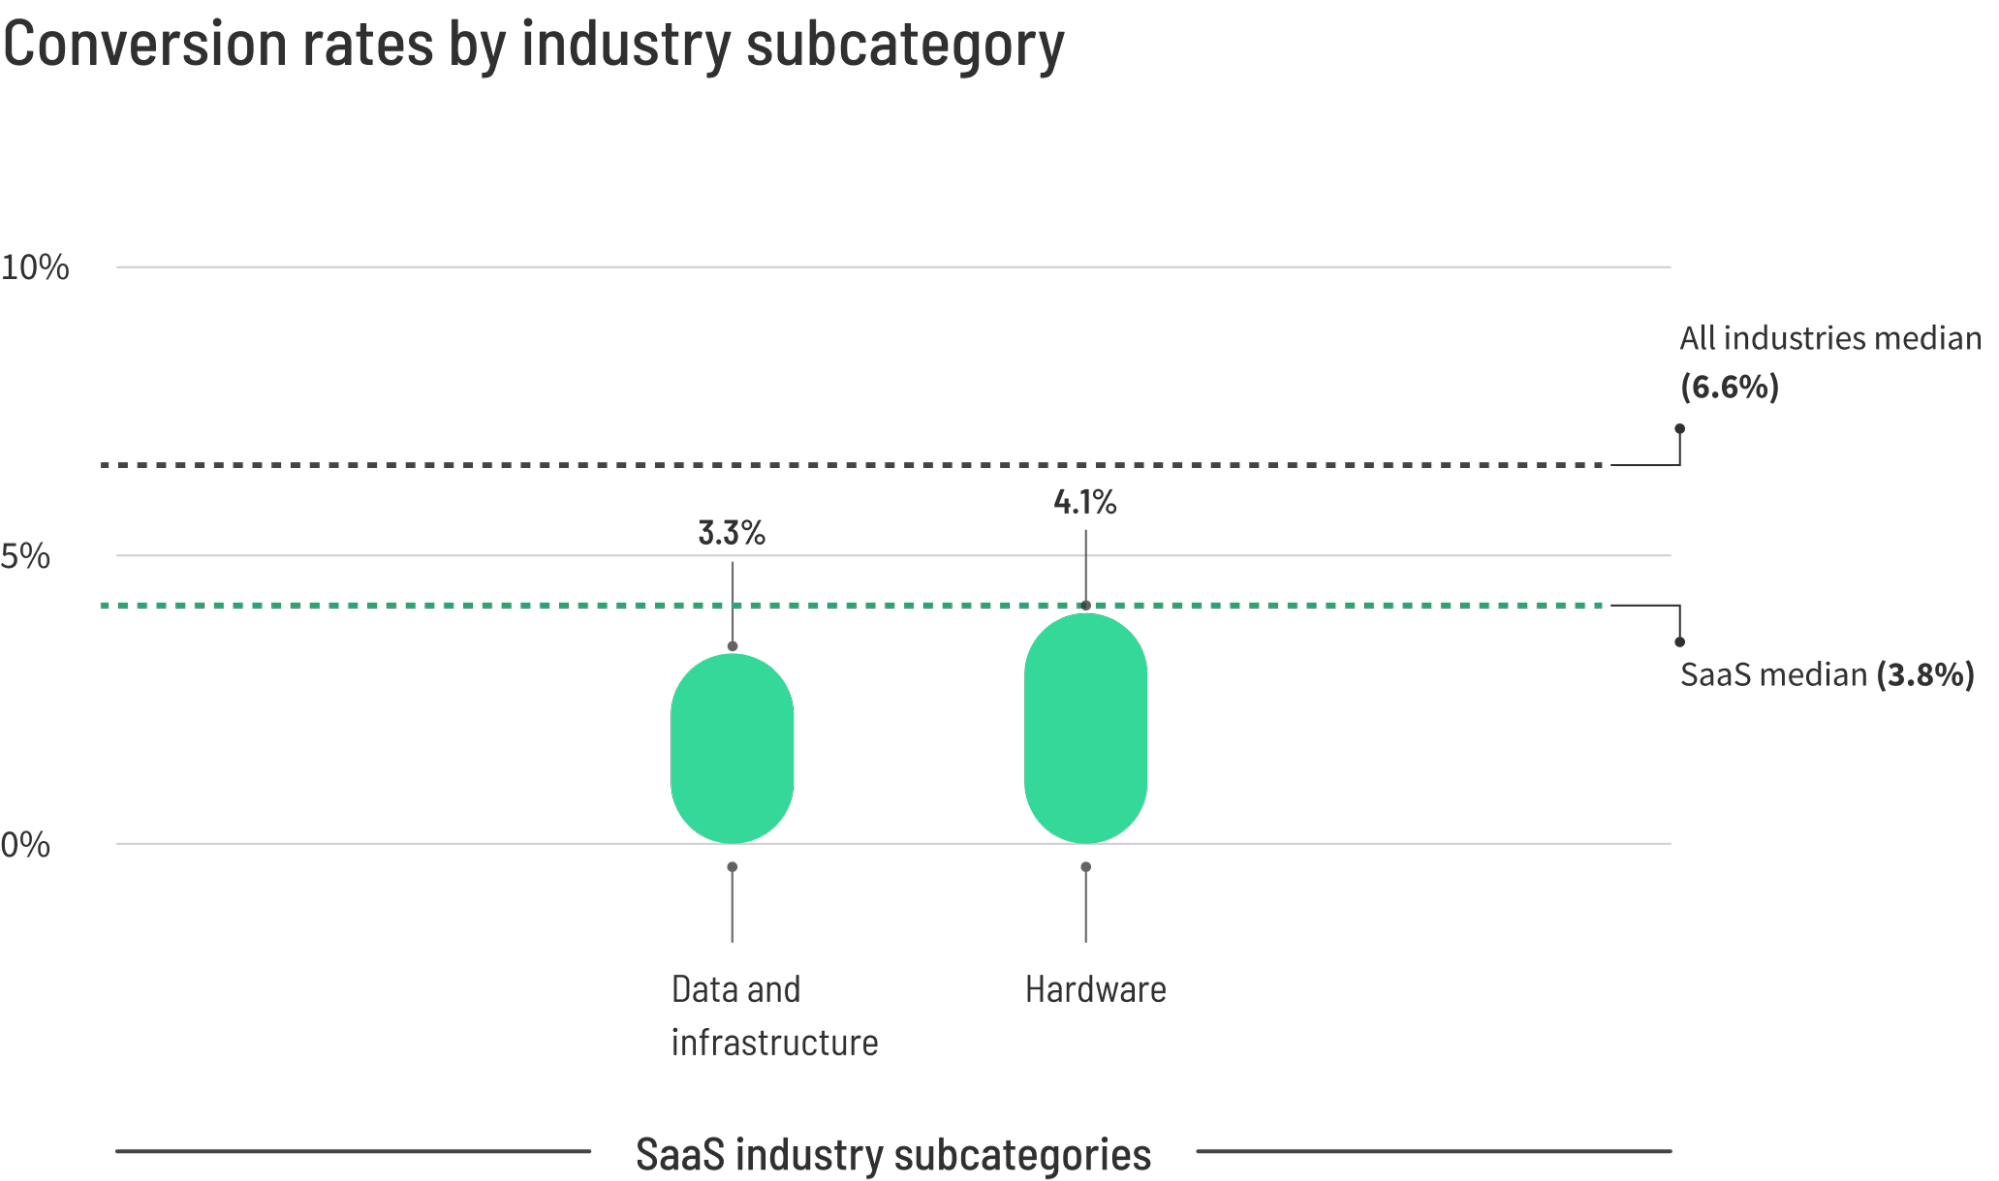
SaaS landing pages sit below the all-industry median, a natural consequence of marketing complex products with extended sales cycles. Visitors arrive with fragmented intent—some are early-stage researchers, while others are ready to trial software immediately.
Hardware-focused SaaS solutions slightly outperform data and infrastructure platforms (4.1% median vs. 3.3%), likely due to clearer, more tangible value propositions. To break into the elite 11.6%+ tier, top SaaS providers rely on risk-reduction mechanics: no-credit-card trials, transparent pricing, and laser-focused copywriting that addresses acute software pain points.
3. Professional Services: The Power of Email and Urgency
Median Conversion Rate: 6.1%
Top 25% Threshold ("Good"): 14.1% or higher
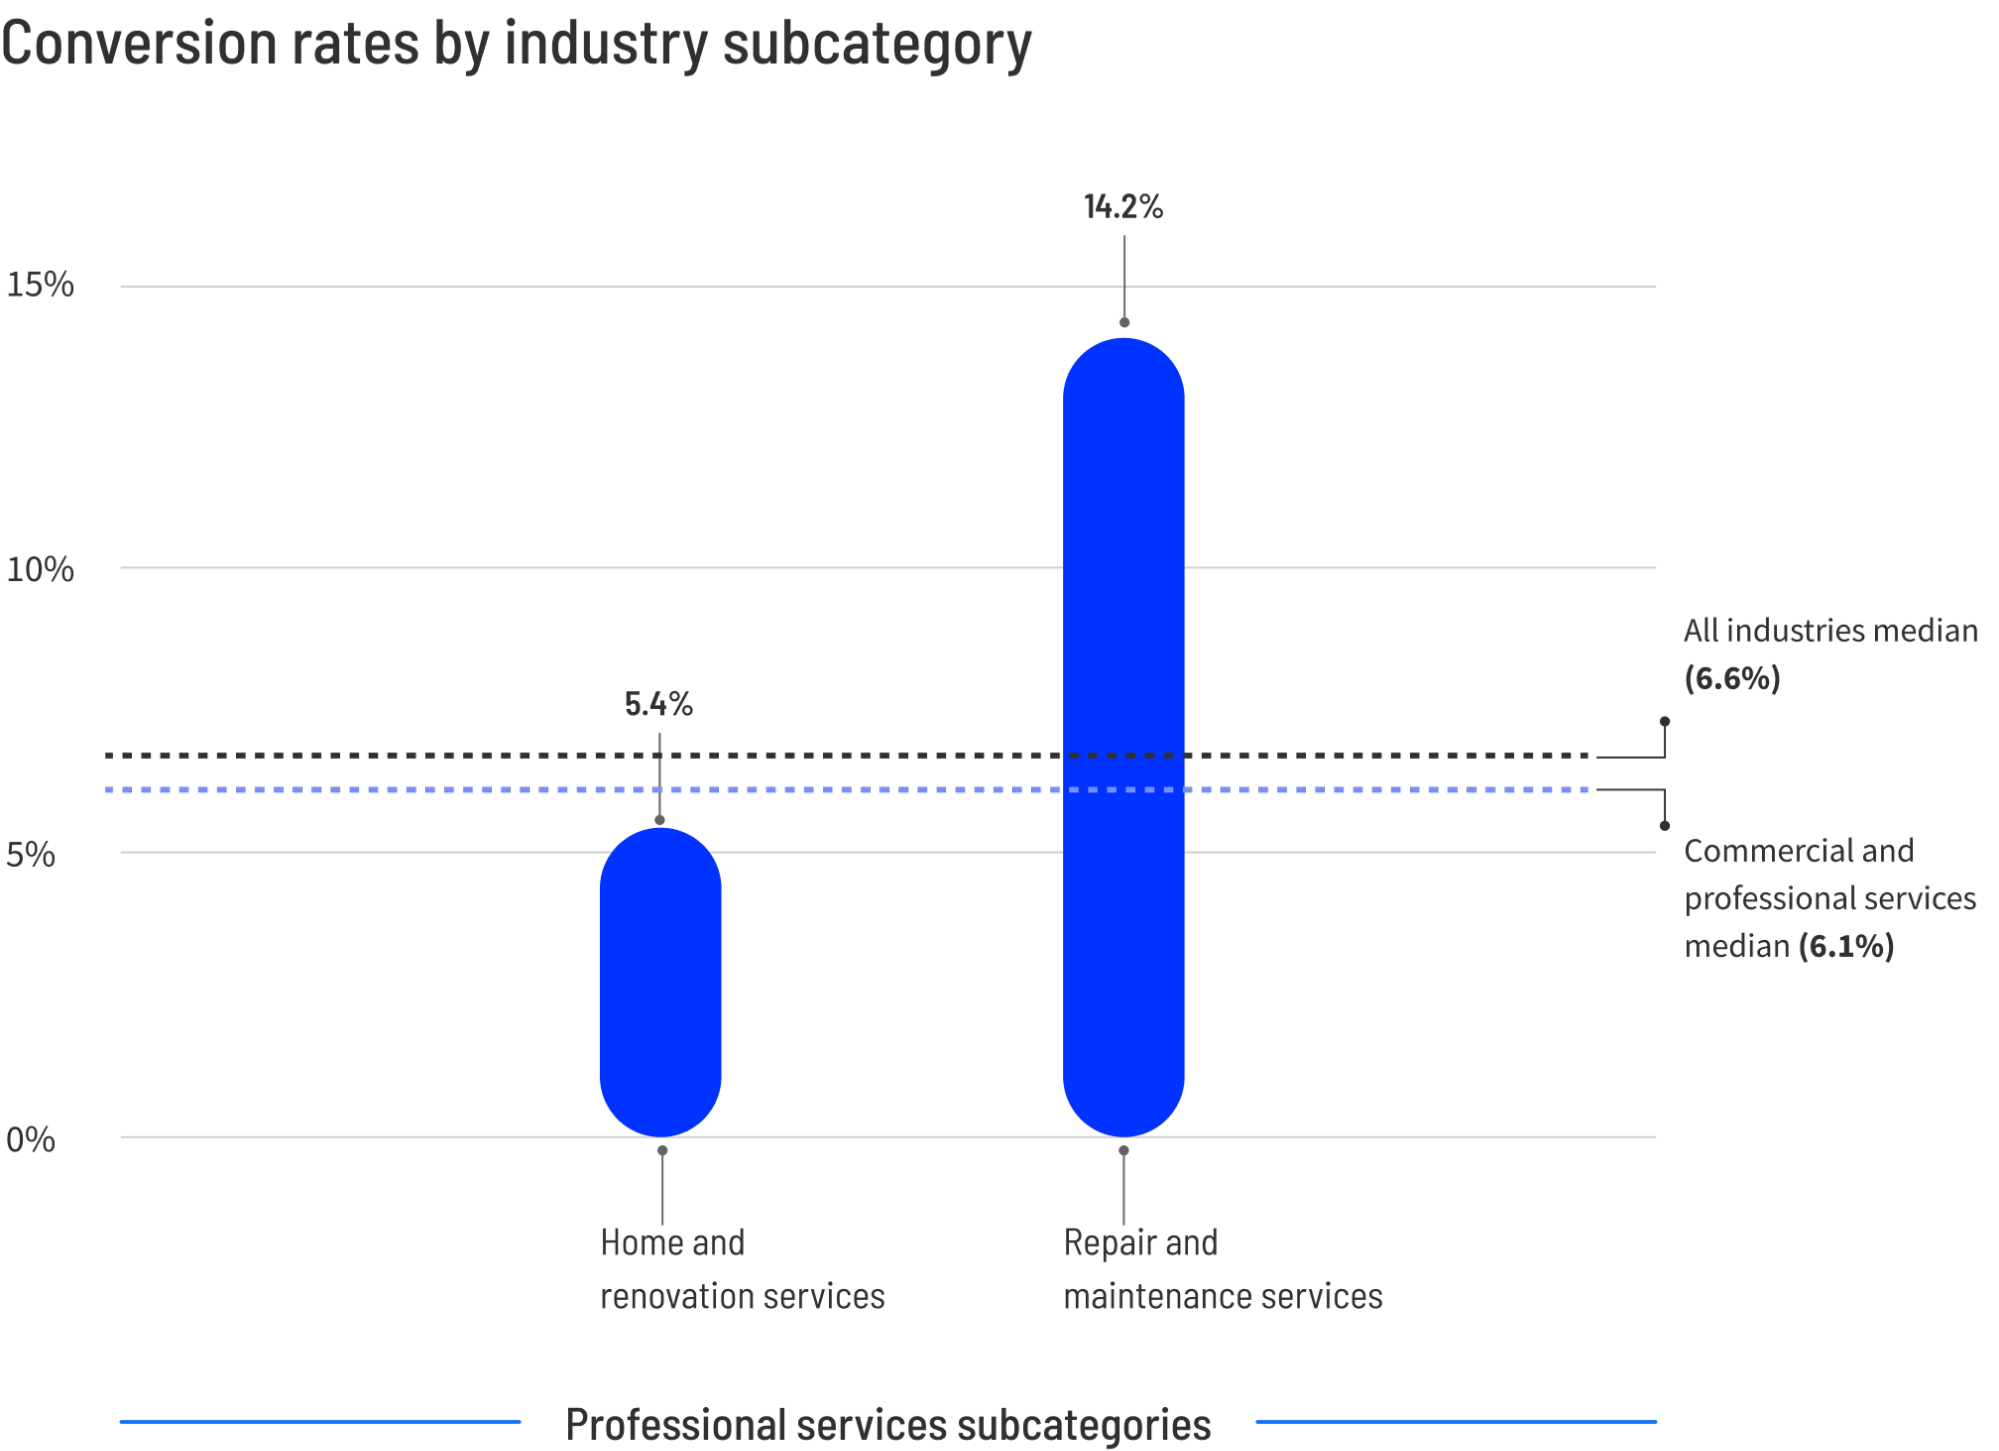
Encompassing law firms, consultancies, and home services, this vertical exhibits dramatic internal variances. For instance, repair and maintenance landing pages convert nearly three times better than home renovation pages. A burst pipe demands immediate action; a kitchen remodel is a luxury project built on deliberation.
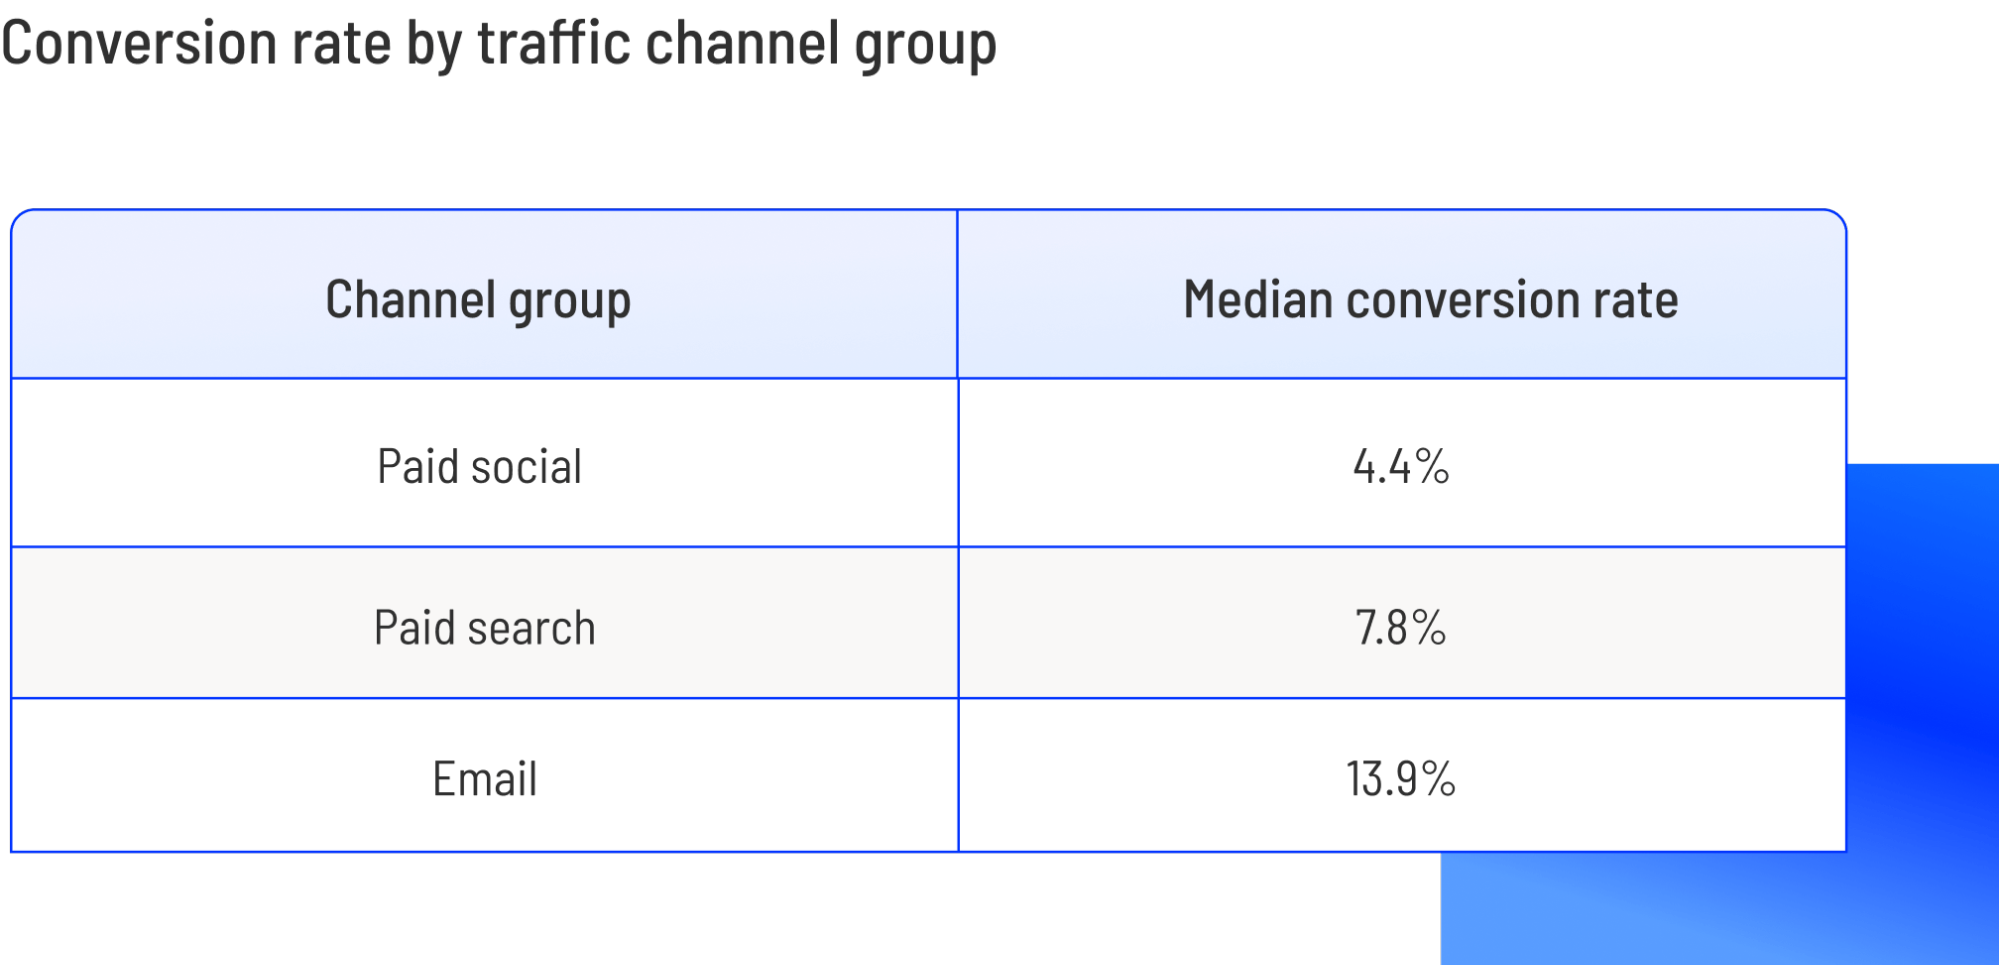
Traffic channels also tell a compelling story here. In the professional services sector, email traffic converts at nearly 14%, while paid social channels lag at 4.4%. Businesses that actively nurture proprietary email lists unlock an asset far more lucrative than cold ad traffic.
4. Financial Services & Insurance: High Intent, High Compliance
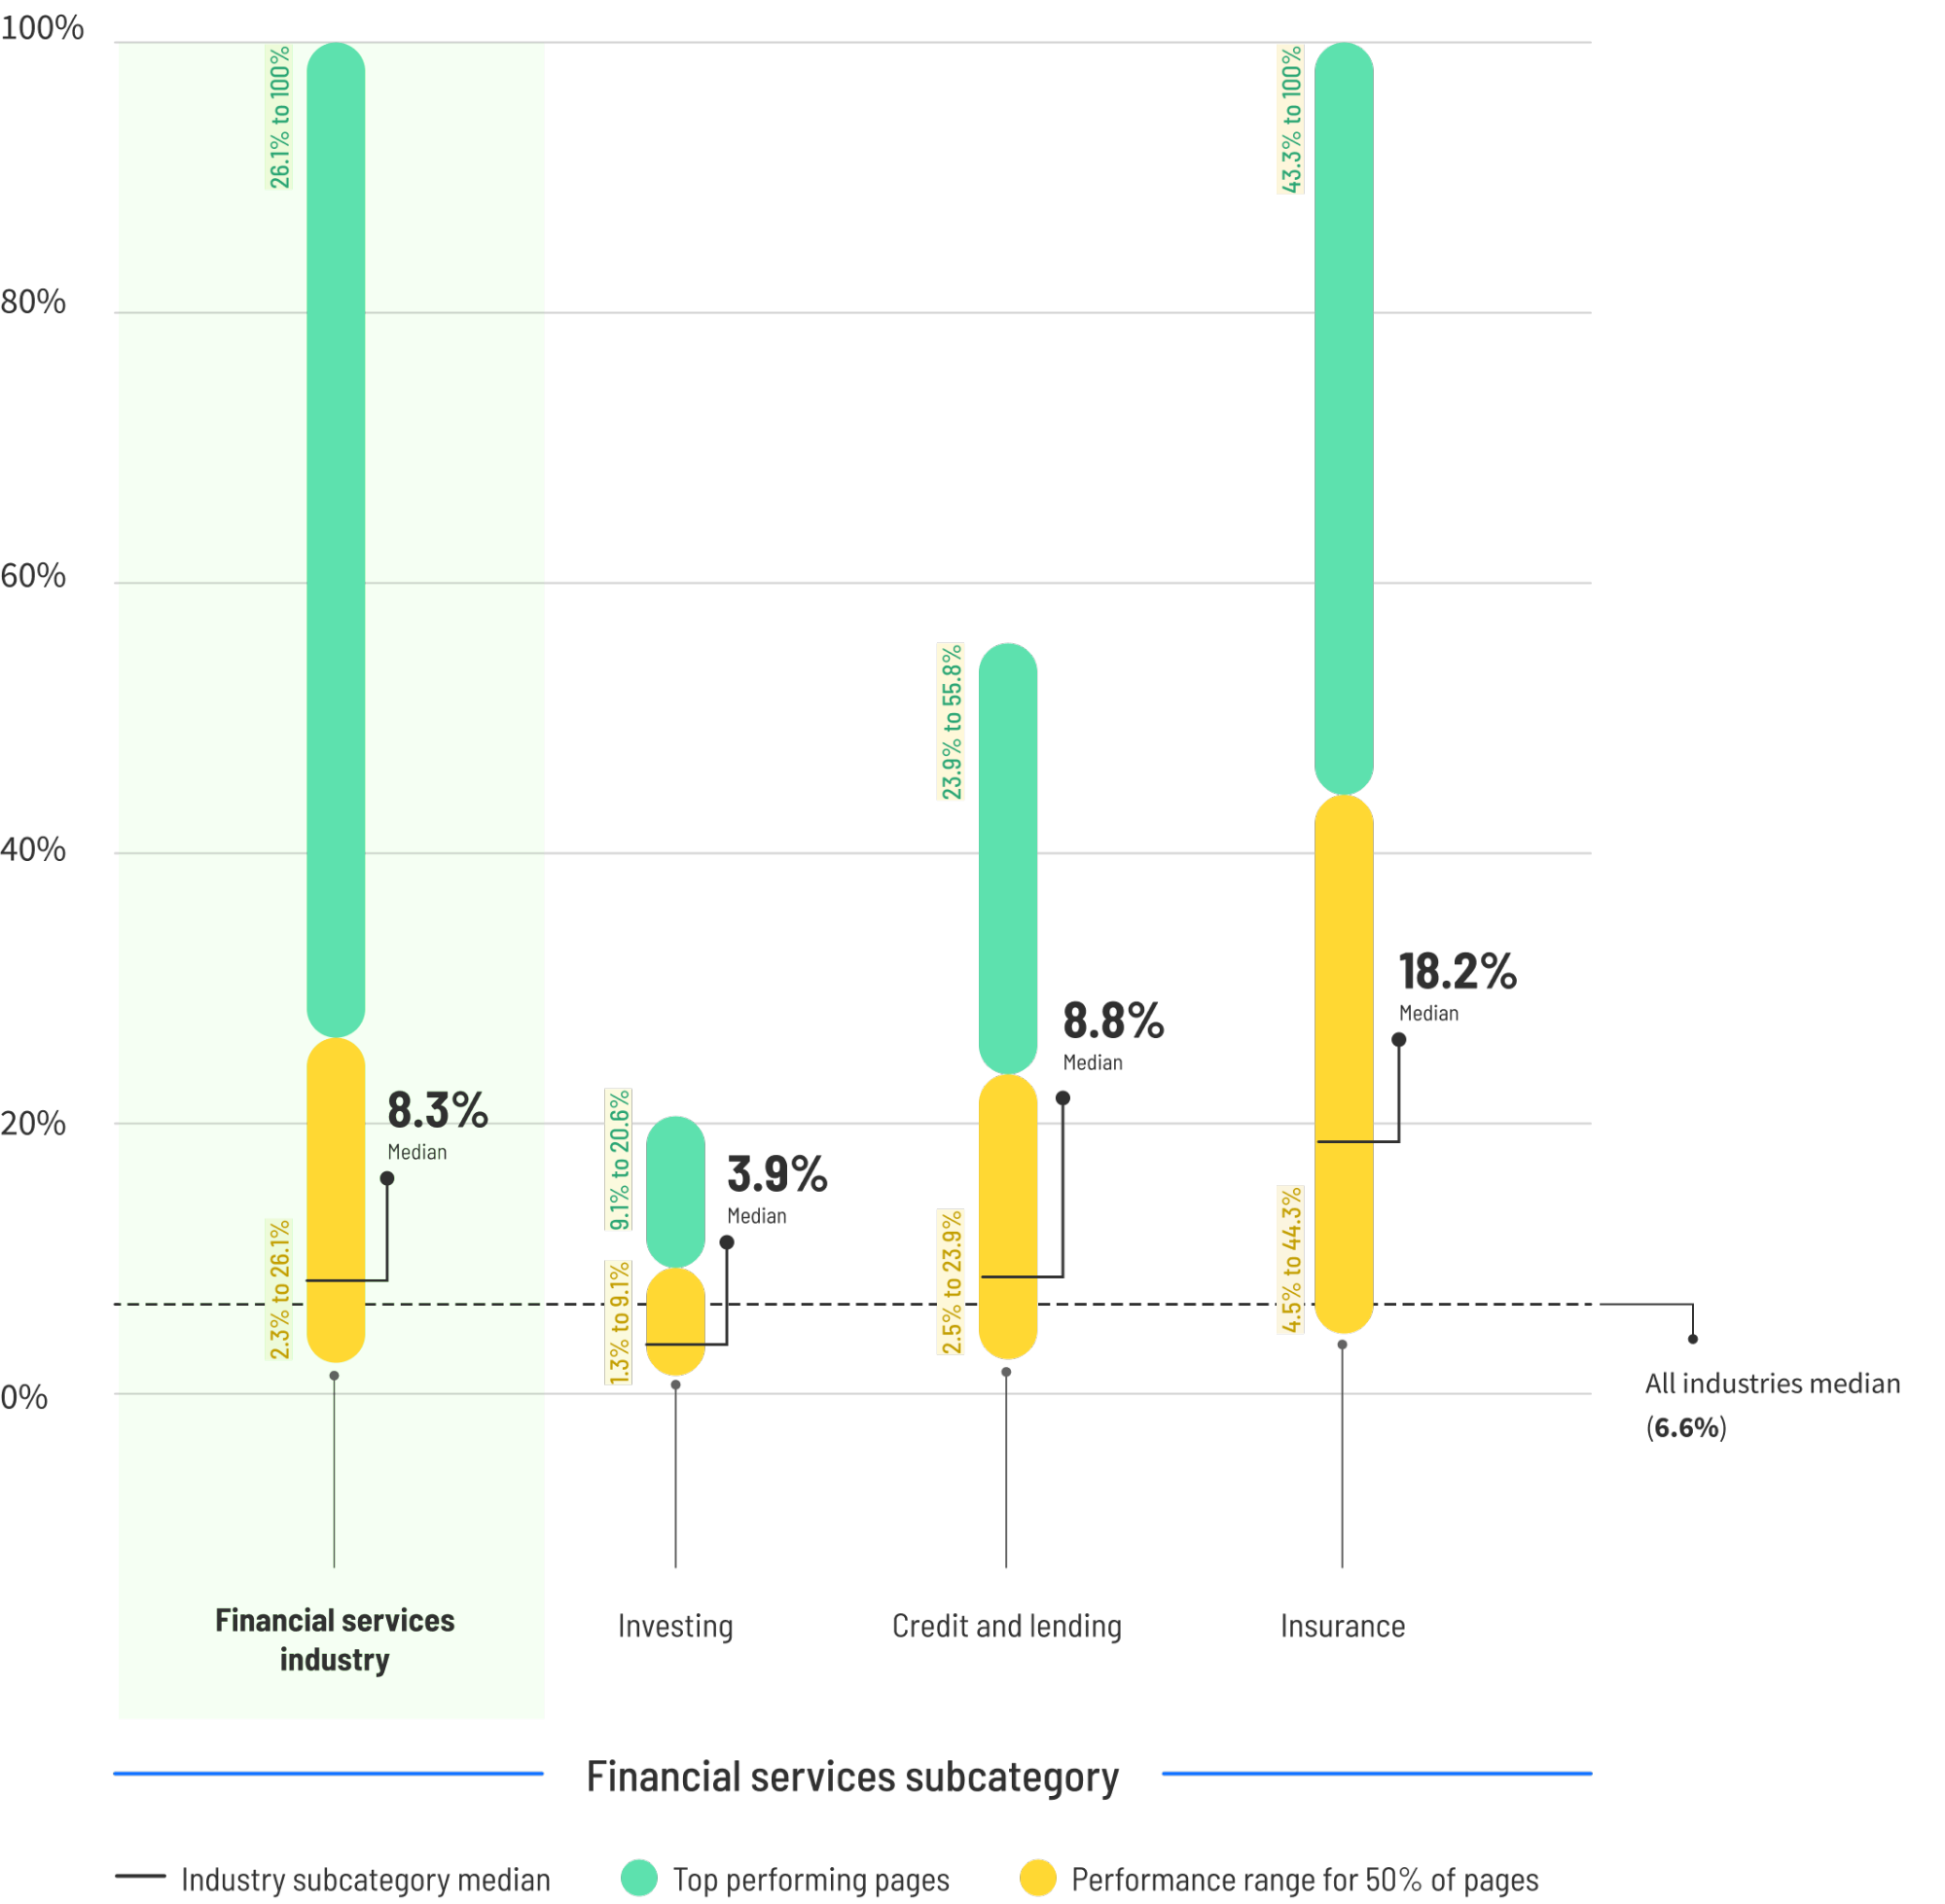
Median Conversion Rate: 8.3%
Top 25% Threshold ("Good"): 18.2%+ (Insurance subcategory)
Financial and insurance landing pages significantly outperform the cross-industry median, driven by high user intent. Consumers rarely browse financial products casually.
Intriguingly, this sector turns traditional device metrics on their head: mobile traffic converts 27.8% better than desktop in financial services. Furthermore, insurance-specific landing pages reach stellar heights, demonstrating that when compliance is balanced with crystal-clear policy benefits, consumer trust follows quickly.
5. Travel & Hospitality: The Desktop Booking Reality
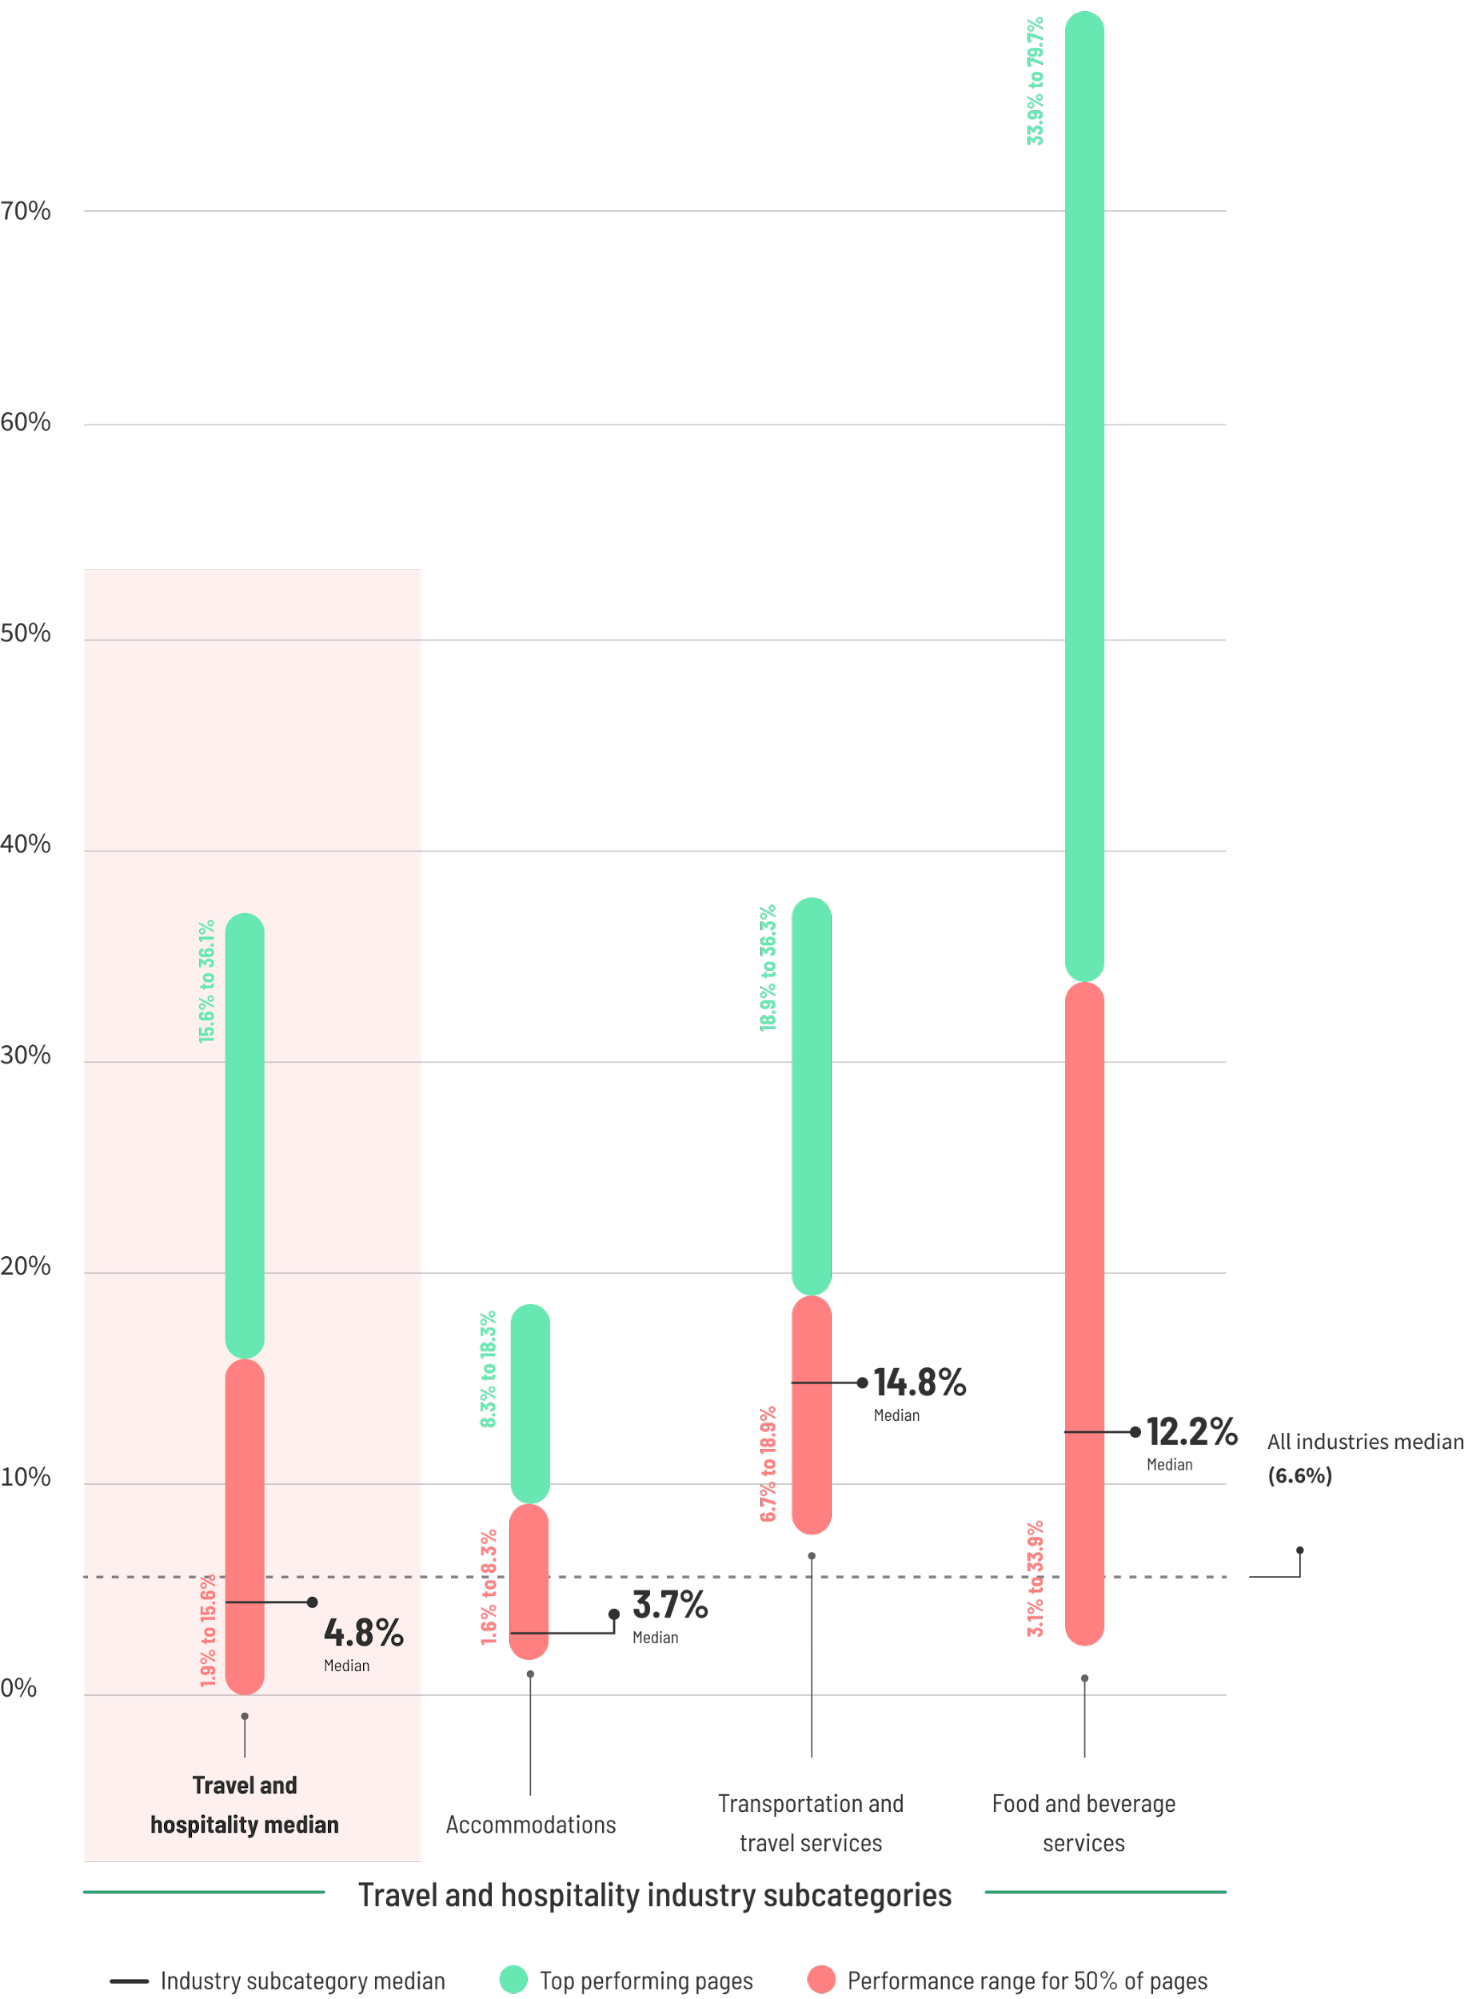
Median Conversion Rate: 4.8%
Top 25% Threshold ("Good"): 15.6% or higher
While travel accommodations (hotels and vacation rentals) hover at a modest 3.7% median, transportation and travel services surge ahead at 14.8%.
The data highlights a critical behavioral trend: while consumers frequently conduct initial travel research on mobile devices, final financial commitments skew heavily toward desktop interfaces. Consequently, desktop traffic converts 10.4% better than mobile in the travel sector, proving that complex, high-ticket checkouts still favor larger screens.
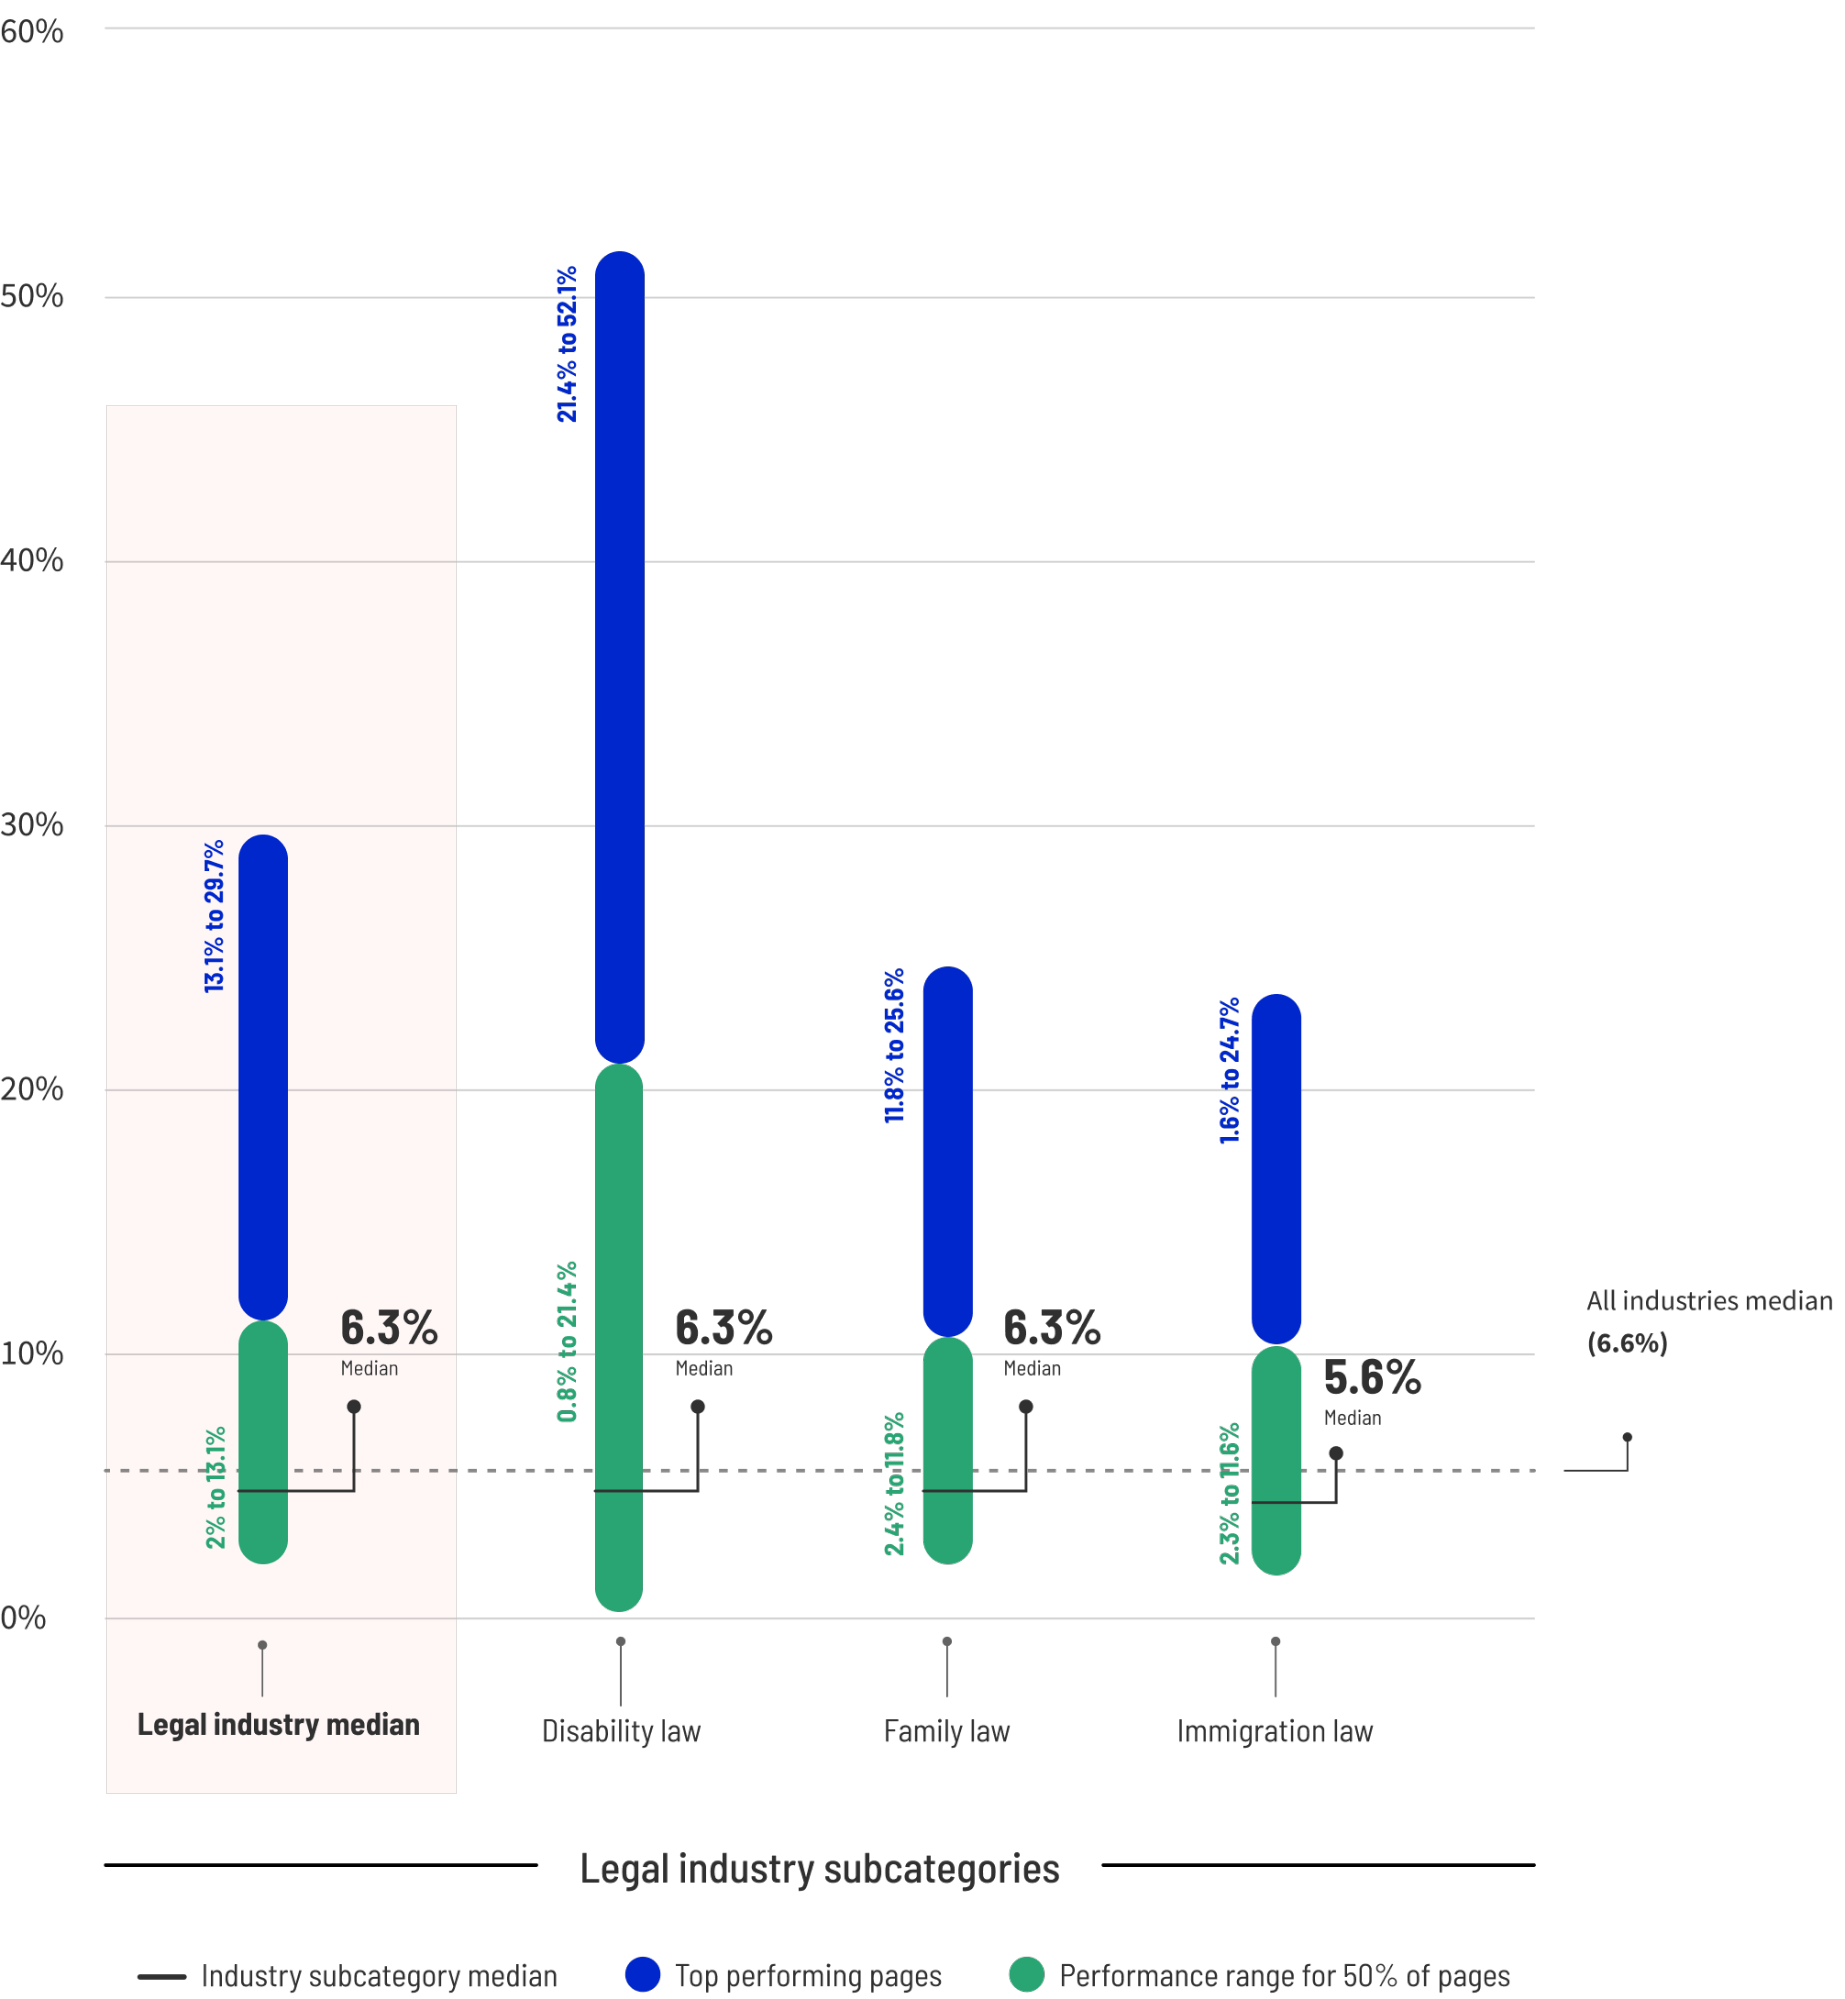
6. Legal Services: The Emergency Response Model
Median Conversion Rate: 6.3%
Top 25% Threshold ("Good"): 13.1% or higher
Legal landing pages flip conventional web usage patterns upside down. Mobile traffic converts at an impressive 21% compared to 15.9% on desktop. This spike makes intuitive sense: individuals involved in accidents, traffic incidents, or sudden legal disputes search frantically from their smartphones.
Paid search traffic performs twice as well as other channels in this space, capturing high-urgency prospects actively typing "lawyer near me" into search engines.
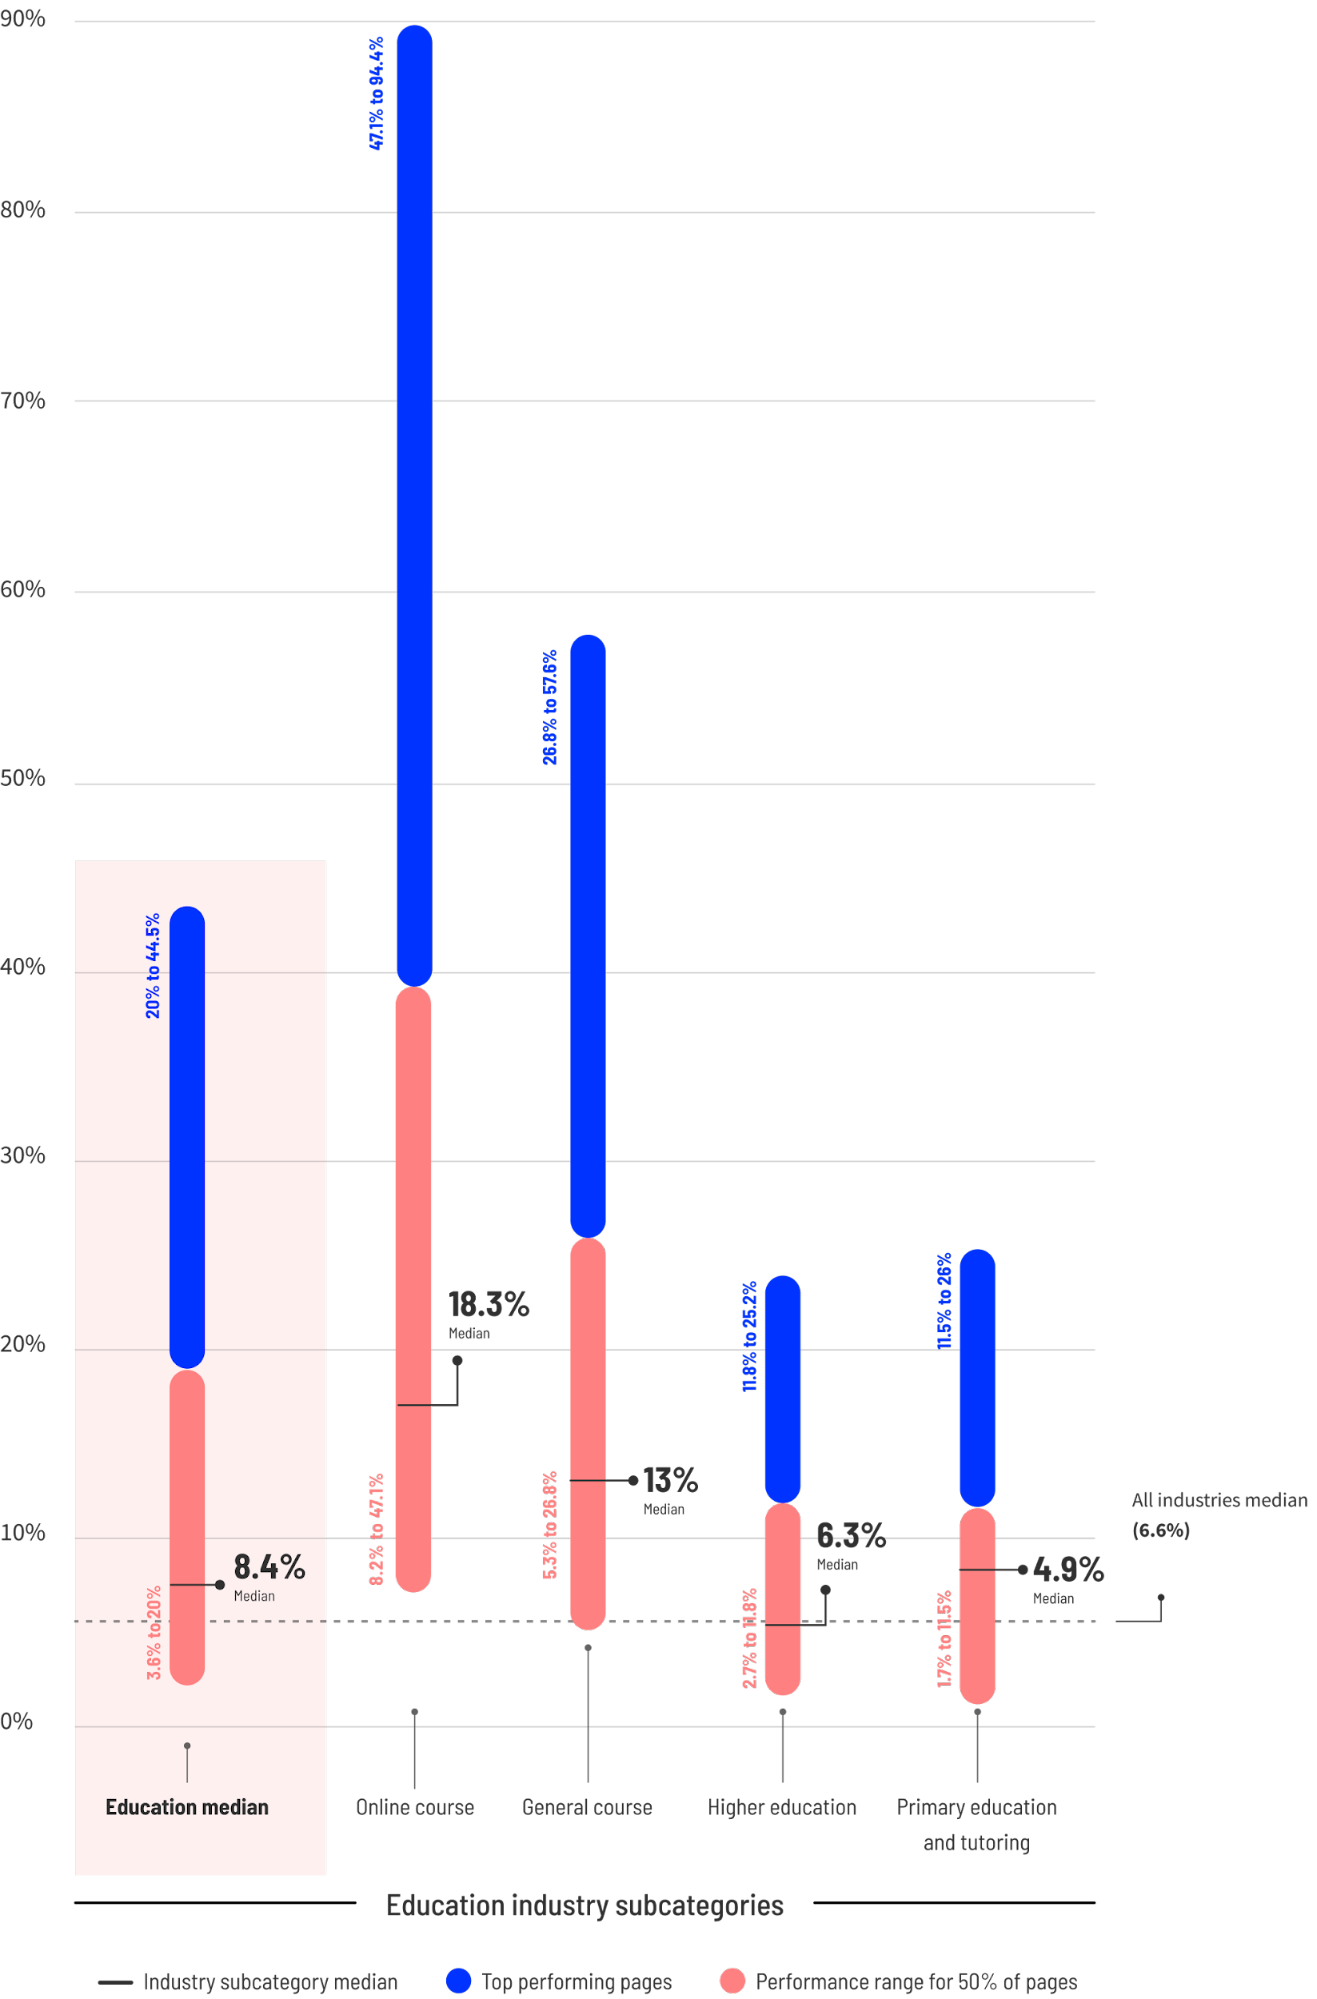
7. Education: Selling Transformation, Not Information
Median Conversion Rate: 6.3% (Higher Ed) to 18.3% (Online Courses)
Top 25% Threshold ("Good"): 20.0% or higher
Education marketers achieve some of the highest conversion rates in the digital ecosystem, led by online course providers. The secret lies in psychological framing: online courses sell immediate career transformation ("Learn Python in 30 days") rather than abstract institutional prestige. Email remains the premier channel here, converting at 14.1% compared to 7.3% for paid search.
8. Entertainment & Sweepstakes: The Spectrum of Action
Median Conversion Rate: Variable (Sweepstakes peak at 47.5%)
Top 25% Threshold ("Good"): 40.8% or higher
Entertainment benchmarks are heavily skewed by sweepstakes and low-friction engagement pages, where clicking "Enter Now" requires minimal commitment. Conversely, subscription-based streaming services face rigorous evaluation, proving that conversion metrics must always be contextualized against the complexity of the conversion action.
Official Industry Statements & Expert Insights
Analyzing the benchmarks, industry leaders emphasize that chasing vanity metrics is a fool’s errand. Josh Gallant, founder of Backstage SEO and contributor to the Unbounce report, notes:
"Not all conversions are created equal—and neither are conversion rates. The number that counts as ‘good’ isn’t one-size-fits-all. It depends on your industry, your audience, and how people find your page in the first place. Think of the median like the average height of all humans: it’s a number, but on its own, it doesn’t tell you much about what’s average for your specific demographic."
Experts agree that modern CRO requires a systematic methodology rather than sporadic aesthetic redesigns. The gap between median performance and top-tier execution is bridged not by luck, but by rigorous optimization of four fundamental pillars:
Message Clarity: Aligning ad copy with landing page headlines instantly.
Cognitive Friction: Reducing form fields and eliminating unnecessary page navigation.
Trust Architecture: Placing authentic social proof adjacent to conversion points.
Intent Matching: Tailoring user journeys specifically to mobile vs. desktop behaviors.
Future Outlook: 5 Actionable Optimization Strategies for Modern Marketers
Knowing where your industry stands is only half the battle; executing structural improvements is what drives revenue. Based on empirical data extracted from top-performing landing pages, marketers looking to scale conversions today should focus on five proven strategies:
1. Simplify Copy to a 5th–7th Grade Reading Level
Complex jargon does not equate to professional sophistication; it creates cognitive friction. Research reveals that pages written at a 5th–7th grade reading level convert at 11.1%—outperforming 8th–9th grade copy by 56% and doubling the conversion rate of pages utilizing overly academic or corporate phrasing. Short sentences, active voice, and plain English win every time.
2. Ruthlessly Simplify Forms and A/B Test CTAs
Avoid asking for too much information too soon. Test single-field email opt-ins against multi-step qualification forms. When running A/B tests, isolate individual variables—such as button color, micro-copy, or form placement—so you can definitively attribute performance gains to specific design choices.
3. Position Strategic Social Proof Near Conversion Points
Do not bury testimonials, trust badges, or client logos at the footer of your landing page where user attention has already waned. Place validation metrics directly adjacent to your primary Call-to-Action (CTA) to reassure hesitating prospects at the exact moment of decision.
4. Engineer a Frustration-Free Mobile Experience
With mobile devices accounting for up to 83% of total landing page traffic, ignoring mobile UX is financial suicide. Ensure page load speeds are optimized, tap targets are easily accessible, and forms are mobile-responsive. Test your pages on physical hardware rather than relying solely on desktop preview modes.
5. Eliminate Exit Distractions
Every navigational link, external outbound reference, or social media icon that does not directly serve the conversion goal is an escape hatch for your user. Strip landing pages down to their bare conversion-focused essentials, keeping the user locked onto a single, compelling path forward.
Conclusion
The 2024 Conversion Benchmark Report makes one thing abundantly clear: digital marketing success is no longer governed by intuition. By understanding the median baselines of your specific vertical—whether you operate in e-commerce, SaaS, legal, or finance—you gain a realistic yardstick against which to measure performance.
More importantly, understanding the gulf between median benchmarks and top-tier performance illuminates a massive runway for growth. By pairing clear messaging, rigorous A/B testing, and a relentless focus on user intent, marketers can systematically dismantle the barriers holding their conversion rates back—turning passive traffic into predictable, scalable revenue.